
Chatbot Statistics 2026: Adoption, ROI and What Customers Actually Want
Before you read any chatbot statistics, answer one question yourself. Yes or no: would you prefer that companies didn’t use AI for their customer service?
Hold on to your answer. When Gartner put roughly that question to 5,728 customers at the end of 2023, 64% said yes. Then, in early 2026, the same firm asked 3,566 customers a different question: would you have used a chatbot on your last service contact if the company had offered one? 49% said yes. Only 7% actually had.
Both results are real, both are published, and they seem to point in opposite directions. That’s what this whole subject looks like up close. The useful numbers exist, but they answer narrower questions than the headlines suggest, and the famous ones often lead nowhere at all.
In this guide, we’ll go through the chatbot statistics that survive being traced back to a named survey, study or official dataset: how many businesses use AI and chatbots, what customers actually want from one, and what the evidence says about return on investment (less than you’d hope). We’ll show you which popular figures we left out and why, and finish with the numbers that matter most, the ones your own bot produces, and where to find them in DMly.
Chatbot Statistics 2026 in Brief: Eight Numbers That Hold Up
The most reliable chatbot statistics for 2026 say that about one business in five uses AI of any kind, far fewer use it for customer service, customers will use a chatbot that works but insist on a way to reach a person, and nobody has measured the return for a small business. Here are the eight figures we’d stand behind, each with the kind of source it comes from.
- 23.8% of US businesses used AI in some business function in the two weeks to 4 October 2026. (Official statistics: US Census Bureau.)
- 7.6% of US businesses used AI for customer service in the previous six months, measured over winter 2025 to 2026. (Official statistics: US Census Bureau.)
- 19.95% of EU businesses with ten or more staff used AI in 2025, but only 17% of small ones against 55% of large ones. (Official statistics: Eurostat.)
- 28.2% of Canadian businesses that use AI use it for virtual agents or chatbots, the only official survey we found that names chatbots outright. (Official statistics: Statistics Canada.)
- 87% of customers say access to a human agent is essential when a company uses AI in customer service. (Analyst survey: Gartner, 2026.)
- Only 27% of customers would try a chatbot again after a bad experience with one. (Analyst survey: Gartner, 2026.)
- 47% of US adults think AI would do customer service worse than people, against 19% who think it would do better. (Independent survey: Pew Research Center.)
- 15% more issues resolved per hour when customer support agents at one large firm were given an AI assistant, with bigger gains for newer staff. (Peer-reviewed study: Quarterly Journal of Economics.)
And the gap that matters most if you run a small business: we found no official figure, peer-reviewed study or transparent dataset on what a chatbot returns for a business of your size. Every ROI figure below comes from a large company. We’ll come back to what you can do about that.
Where Trustworthy Chatbot Figures Come From: The Labels on This Page
Good chatbot statistics come from someone who counted real businesses or asked a stated number of real people a published question, and who tells you when and how. Most of the numbers that circulate online fail that test. They get copied from list to list until nobody remembers where they started.
So every figure on this page carries a label for the kind of source behind it:
- Official statistics: national statistics offices (the US Census Bureau, Eurostat, the UK’s Office for National Statistics, Statistics Canada, the Australian Bureau of Statistics) and the OECD. Huge samples, published methods, no product to sell. Their weakness is that they ask about “AI” broadly, and only a few ask about chatbots at all.
- Independent survey: a non-profit pollster such as Pew Research Center, with a probability-based panel and the full questionnaire published.
- Analyst survey: a research firm such as Gartner that states its sample and dates. Useful and large, but the firm sells advice to the service leaders it’s surveying customers on behalf of, and you usually see the press release rather than the questionnaire.
- Vendor research: a survey run or paid for by a company that sells customer service software. Not worthless, but it has an interest in the answer, so we only use it when it states its sample and method, and we say who ran it.
- Peer-reviewed study: academic research checked by other researchers before publication. The strongest evidence on outcomes, but usually from one large company and one kind of conversation.
- Company claim: a firm describing its own results. We use one, from a filing made to a securities regulator, and treat it as a claim rather than a finding.
One more thing to watch: the word “chatbot” covers everything from a menu of buttons to an AI agent that books appointments. Most surveys don’t separate the two. If you’re not sure which you need, our explainer on the difference between an AI agent and a chatbot sorts it out in one example.
How Many Businesses Use AI Chatbots? Chatbot Adoption Statistics for 2026
Around one business in five in most rich economies now uses AI in some form, but only a small minority use it for customer service: 7.6% of US businesses in the latest official reading. The difference between those two numbers is the most important thing to understand about chatbot adoption statistics, because most headlines quote the first and imply the second.
United States
The US Census Bureau’s Business Trends and Outlook Survey (BTOS) asks a sample of about 1.2 million employer businesses every two weeks whether they used AI in any business function. In the collection that closed on 4 October 2026, 23.8% said yes, and 27.7% expected to be using it within six months. (Official statistics, published as experimental data.)
Two cautions before you quote that. First, Census changed the question’s wording on 17 November 2025, from AI used “in producing goods or services” to AI used “in any of its business functions”, and started a new series because the level jumped. The last reading on the old wording was 10.0%. So a chart showing US adoption leaping from 10% to 24% is mostly a change of question, not a change of behaviour.
Second, “any business function” includes a staff member drafting emails with a chatbot. For customer service specifically, Census ran a one-off supplement between 17 November 2025 and 8 February 2026. It found 7.6% of US businesses had used AI for customer service in the previous six months, against 14.3% for sales and marketing. That’s the closest thing to an official US chatbot adoption figure that exists.
European Union
Eurostat’s 2025 survey of 157,000 enterprises with ten or more staff found 19.95% used at least one AI technology, up 6.47 percentage points on 2024. Denmark led at about 42%, Romania trailed at about 5%. Among businesses using AI, 34.70% used it for marketing or sales. Eurostat doesn’t publish a chatbot or customer service category, so there is no official EU chatbot figure. (Official statistics.)
United Kingdom
The Office for National Statistics’ fortnightly business survey (BICS) found that 30% of UK businesses used at least one type of AI technology in late September 2026, rising to 38% of businesses with ten or more employees. Text generation by large language models was the most used type among those larger firms. There is no customer service or chatbot breakdown. (Official statistics in development; voluntary survey, about 9,900 responses.)
Canada, Australia and the OECD
Statistics Canada is the one office that names chatbots. In its survey for the second quarter of 2026, 19.2% of Canadian businesses had used AI to produce goods or deliver services in the past year, and 28.2% of those AI users used it for virtual agents or chatbots. Multiply the two and you get roughly one Canadian business in twenty using a chatbot, which sits close to the US customer service figure. (That multiplication is ours, not Statistics Canada’s.) (Official statistics.)
In Australia, the Bureau of Statistics found 12% of businesses used AI in the 2024 to 2025 financial year. Across OECD countries with data, the OECD reported 20.2% of firms using AI in 2025, up from 8.7% in 2023. (Official statistics.)
India, Nigeria and the Gulf
We looked for an official survey of business AI or chatbot use from India’s statistics ministry, Nigeria’s National Bureau of Statistics and the Gulf states, and found none. Figures you’ll see quoted for these markets come from vendor surveys or news stories without a traceable method, so we haven’t printed one. If you’re in Lagos, Pune or Dubai, the honest position is that nobody has counted.
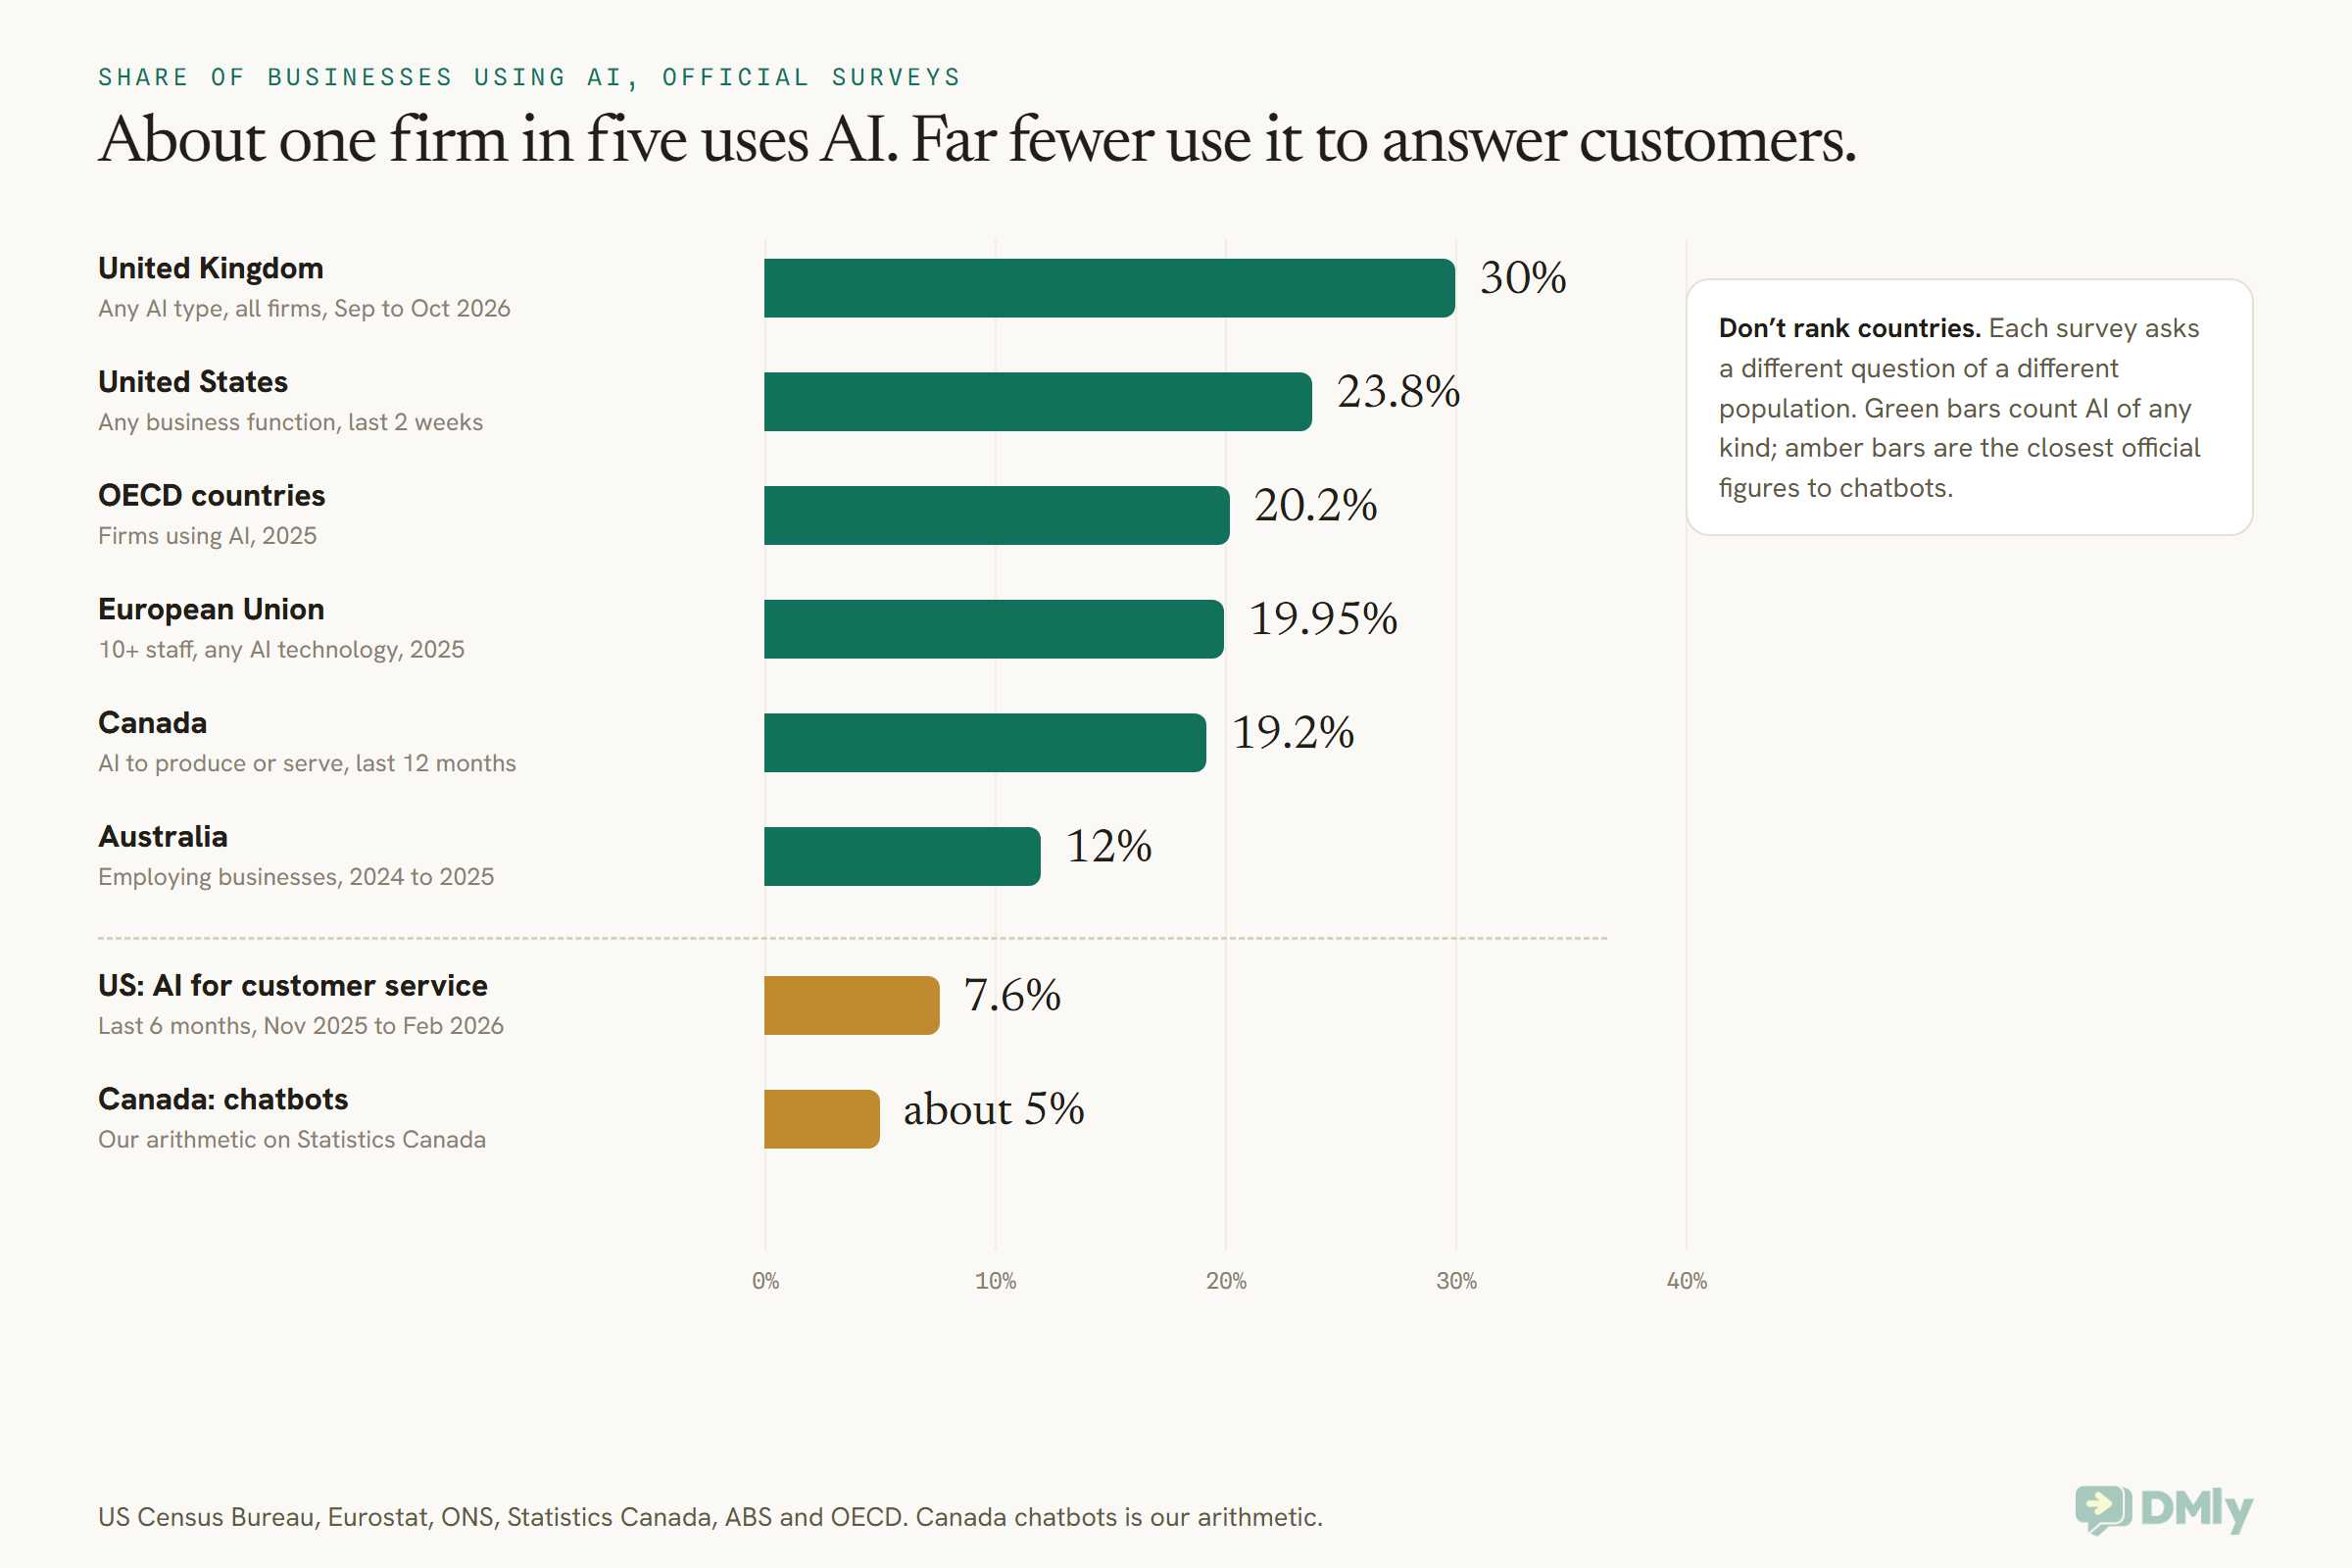
How solid is this?: Very solid for “AI of any kind”: large official samples, published methods, recent data. Thin for chatbots specifically: one US one-off supplement and one Canadian survey that has now run its final edition. Nothing official for India, Nigeria or the Gulf.
Are Small Businesses Using Chatbots? The Size Gap
Small businesses use AI less than large ones almost everywhere, and the gap is widest in Europe; for customer service in the US, the largest firms are about twice as likely to use AI as the smallest. But the gap is smaller than you might think, and in the US the very smallest firms are not the laggards.
| Source | Smallest firms | Largest firms | Label |
| US Census BTOS, any AI, Sep to Oct 2026 | 23.9% (1 to 4 staff) | 36.5% (250+ staff) | Official |
| US Census BTOS, AI for customer service, Nov 2025 to Feb 2026 | 7.1% (1 to 4 staff) | 14.2% (250+ staff) | Official |
| Eurostat, any AI, 2025 | 17% (10 to 49 staff) | 55.03% (250+ staff) | Official |
| OECD, any AI, 2025 | 17.4% (small) | 52.0% (large) | Official |
| ONS, any AI, Sep to Oct 2026 | 29% (under 10 staff) | 38% (10+ staff) | Official |
| Statistics Canada, chatbots among AI users, Q2 2026 | 28.2% (all AI users) | 50.5% (AI users with 100+ staff) | Official |
| UK DSIT AI Adoption Research, Feb to May 2025 | 14% (micro) | 36% (large) | Commissioned by government |
Look at the US row closely. One-to-four-person businesses (23.9%) use AI slightly more than five-to-nine-person ones (21.5%), probably because a sole trader using a chatbot to write a quote counts the same as a firm with a policy. The customer service row is different: a large firm is twice as likely to have put AI in front of its customers. That fits what you’d expect. A big firm has the volume of repetitive questions that makes it worth the setup, and the staff to build and watch it.
The UK pair is a useful warning too. The government-commissioned DSIT study found 16% of UK businesses using AI in spring 2025, while the ONS’s own survey found 30% by autumn 2026. Different years, different questions, different ways of asking. Neither is wrong; they just aren’t the same measurement, and anyone who puts them on one line chart is inventing a trend.
How solid is this?: Solid on the direction (bigger firms use more AI, and especially more customer-facing AI). Too broad to tell you what businesses like yours, in your sector, are doing with chatbots. No survey we found breaks chatbot use down for salons, clinics, gyms or restaurants.
What Customers Actually Want From a Chatbot
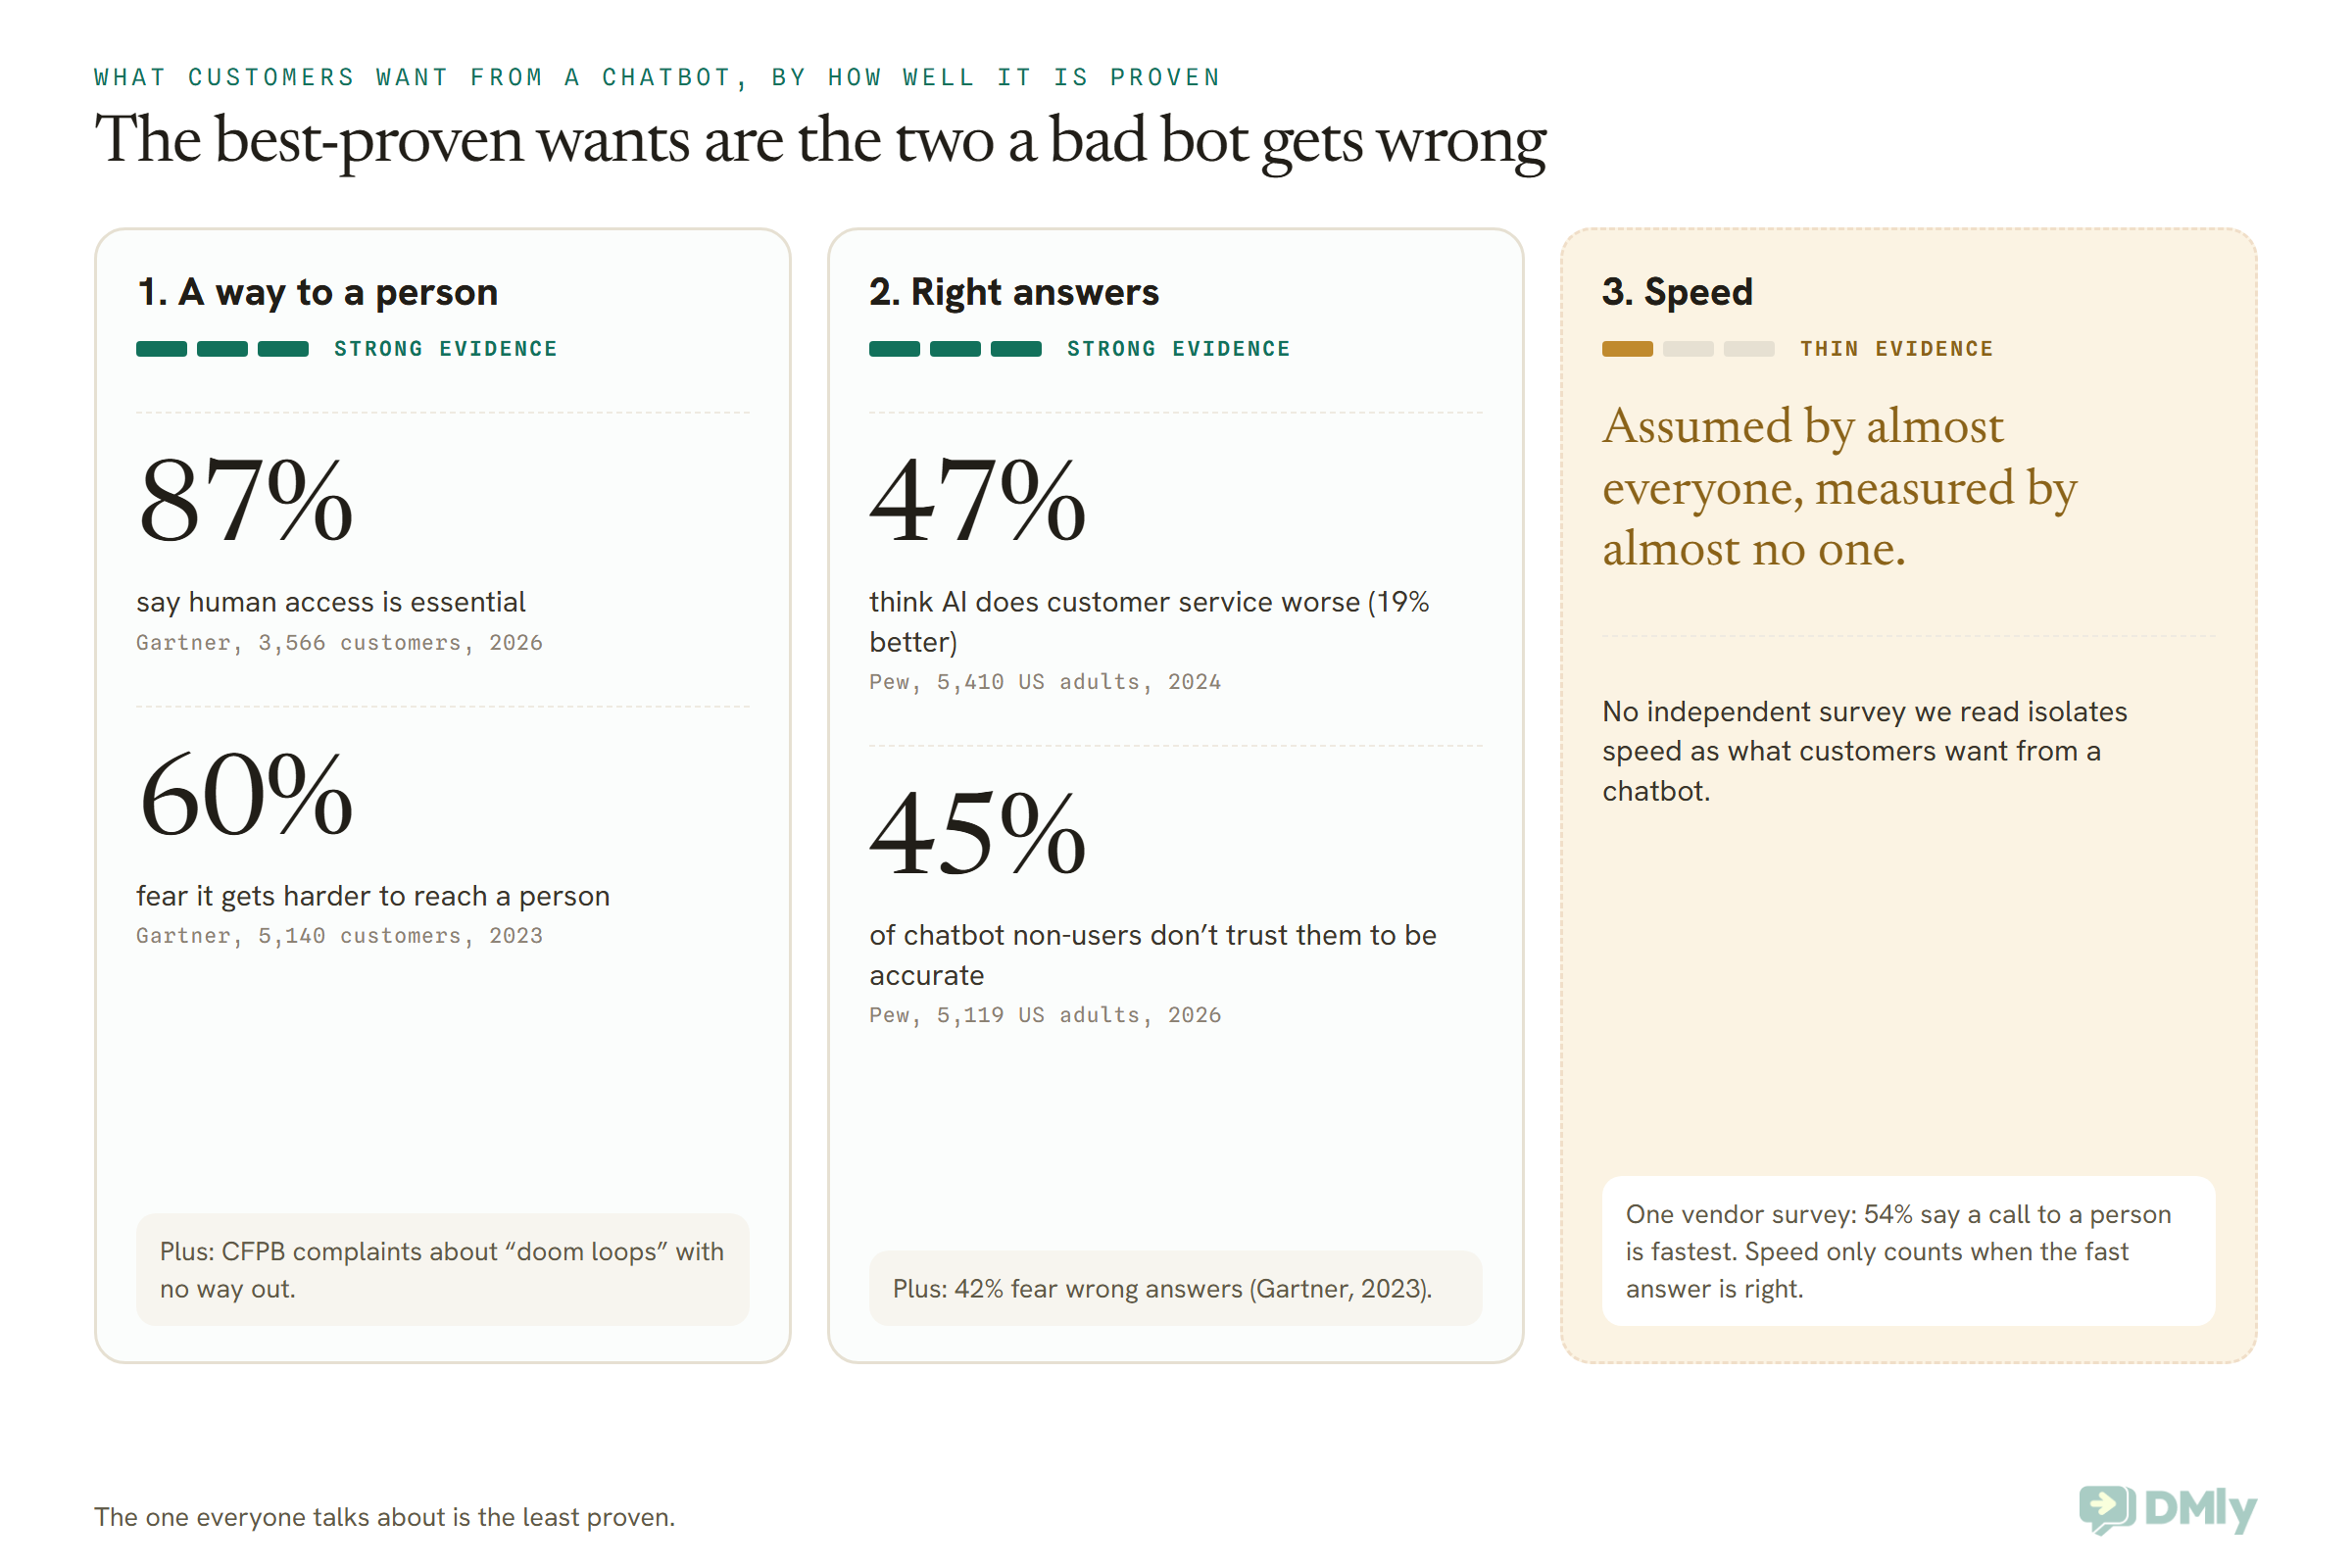
The evidence says customers want three things from a chatbot, in this order of how well it’s proven: a quick way to reach a person, answers that are right, and speed. The first two are backed by large surveys. The third is assumed by almost everyone and measured by almost no one, at least for chatbots.
1. A way to reach a person
This is the strongest finding in the whole field. In Gartner’s 2026 survey of 3,566 customers, 87% said access to a human agent is essential when companies use AI in customer service. In its earlier survey, when asked about their major concerns with AI customer service, the most common answer, from 60% of 5,140 respondents, was that it would become more difficult to reach a person. (Analyst surveys.)
The US Consumer Financial Protection Bureau reached the same place from a different direction. Its 2023 review of chatbots in banking found that all ten of the largest US commercial banks used them, and its consumer complaints described “doom loops” of repetitive, unhelpful answers and bots that couldn’t hand over. The CFPB warned that the route to human help could be “further blocked through unreasonable waits.” It didn’t publish how many complaints it reviewed, so treat this as a pattern, not a percentage. (Government review.)
A vendor survey adds a sharper number: in UJET’s 2022 survey of about 1,700 consumers, 78% said they’d been forced to connect with a human after a chatbot couldn’t help. UJET sells contact centre software, and the figure is four years old, so it sits below the others. (Vendor research.)
2. Answers they can trust
The second most common worry is wrong answers. In Gartner’s 2024 chart, 42% named “AI will provide the wrong answers” as a major concern. Pew Research Center’s February 2026 survey of 5,119 US adults asked people who don’t use chatbots at all why not: 45% gave “I don’t trust them to give accurate information” as a major reason. That’s about general chatbots, not customer service bots, but it’s the same doubt your customer brings to your bot. (Analyst survey; independent survey.)
Pew also asked directly about customer service. In August 2024, 47% of US adults said AI would do worse than people whose job is to provide customer service, and only 19% said better. The AI experts Pew surveyed at the same time leaned the other way: 42% better, 38% worse. Customers, in other words, are more sceptical than the people building the tools. (Independent survey, n=5,410 public and 1,013 experts.)
3. Speed, which everyone assumes
Here’s the surprise. Speed is the reason most businesses give for adding a chatbot, and it’s the reason most articles give for why customers like them. Yet we couldn’t find an independent survey, read at source, that isolates speed as what customers want from a chatbot specifically. The speed evidence mostly comes from the supply side: studies and companies measuring how fast issues get resolved.
One vendor survey even cuts the other way. In the same UJET study, 54% of consumers said a phone call with a live agent was the fastest way to get help. (Vendor research.) That doesn’t mean speed doesn’t matter. Our WhatsApp business statistics page covers the wider evidence on how quickly customers expect a reply on messaging. It means speed only counts if the fast answer is right and leads somewhere.
4. Knowing it’s a bot, and when it backfires
Peer-reviewed research adds a twist. In a field experiment with more than 6,200 customers, Luo and colleagues found that undisclosed AI sales callers sold as well as proficient human staff and four times better than inexperienced staff, but telling customers up front that they were talking to a machine cut purchase rates by more than 79.7%. Those were structured outbound sales calls, not support chats, so don’t stretch it too far. (Peer-reviewed study, Marketing Science, 2019.)
Two later studies explain why. Castelo and colleagues found people rate identical service as worse when it comes from a bot, a penalty that disappears when the business visibly shares the savings (through lower prices) or the bot is clearly better. Crolic and colleagues found that for customers who arrive angry, a chatbot dressed up with a human-like persona makes satisfaction and purchase intentions worse, not better. (Peer-reviewed studies, Journal of Consumer Research, 2023; Journal of Marketing, 2022.)
The practical reading isn’t “hide the bot”. It’s: be upfront, make it genuinely useful, and don’t put a cheerful persona between an upset customer and a person.
Do Customers Prefer Chatbots? Where the Statistics Contradict Each Other
No: the best chatbot statistics show customers don’t prefer chatbots, but about half will use one that’s offered, and most give it one chance. The apparent contradictions mostly come from different questions, so it’s worth laying them side by side.
| Sounds like | What was actually measured | Source |
| 64% don’t want AI in customer service | Share who would prefer companies didn’t use AI for customer service (Dec 2023) | Gartner, 5,728 customers |
| 49% want chatbots | Share who would have used a chatbot on their last service contact if the company had provided one (Feb to Mar 2026) | Gartner, 3,566 customers |
| Only 7% use chatbots | Share who used a chatbot or digital assistant in their most recent service interaction (Feb to Mar 2026) | Gartner, 3,566 customers |
| 53% will leave over AI | Share who would consider switching to a competitor if they found out a company was going to use AI for customer service (Dec 2023) | Gartner, 5,728 customers |
| 63% will leave after one bad experience | Share willing to switch after one bad experience of any kind, not AI specifically (Jun to Jul 2024) | Zendesk, about 5,100 consumers, 22 countries (vendor) |
Read together, they tell one consistent story. People would rather not be pushed into AI (64%). Asked about a concrete situation, half would have tried a chatbot (49%), but hardly anyone did (7%). And when they try one and it fails, most won’t come back: only 27% would try a chatbot again after a negative experience. Gartner calls this a “leaky bucket”, and it’s the single most useful number on this page for a small business. Your bot gets one chance per customer, so a bot that’s live but half-built does lasting damage.
There’s one more wrinkle in the 2026 Gartner release: customers were about three times more likely to have used a third-party AI tool, one that doesn’t belong to the company, than the company’s own chatbot during their last service contact. People are getting used to asking AI questions. They just aren’t yet asking yours.
How solid is this?: Medium. Gartner’s samples are large and dated, but they reach us as press releases rather than full questionnaires, and the two surveys use different questions, so they can’t be read as a trend from 64% to 49%. Pew’s figures are the most transparent and point the same way.
When Chatbots Get It Wrong: What the Record Shows
The clearest evidence on chatbot accuracy isn’t a percentage; it’s a legal ruling that a business is responsible for whatever its chatbot tells customers.
In February 2024, British Columbia’s Civil Resolution Tribunal decided Moffatt v. Air Canada. After their grandmother died, a customer asked the airline’s website chatbot about bereavement fares. It told them they could apply for the reduced fare after travelling, within 90 days of the ticket being issued. The airline’s own policy page said the opposite: no claims after travel. Air Canada argued it couldn’t be held liable for information from its representatives, including a chatbot. The tribunal called that “a remarkable submission”. It said it “should be obvious to Air Canada that it is responsible for all the information on its website”, found negligent misrepresentation, and ordered the airline to pay C$812.02. (Court record.)
The sum is small. The principle isn’t. If your bot quotes the wrong price for a balayage in Atlanta, promises a refund your clinic in Bengaluru doesn’t offer, or gives a delivery date your shop in Abuja can’t meet, you’re the one who said it.
That’s why the accuracy work happens before launch, not after: the bot should answer from your own price list and policies rather than from general knowledge, and hand over anything it isn’t sure of. Our guide to building an AI customer service chatbot for WhatsApp shows how to build the knowledge base it answers from and how to test it before a customer does.
Chatbot ROI Statistics: What the Evidence Can and Cannot Show
The honest summary of chatbot ROI statistics is that the solid evidence is about AI helping human staff at very large companies, the dramatic savings figures are company claims or old forecasts, and nobody has measured the return for a small business. Here’s what each piece of evidence actually shows.
The strongest study: AI helping agents, not replacing them
The best-known research is by Erik Brynjolfsson, Danielle Li and Lindsey Raymond, published in the Quarterly Journal of Economics in 2025. They studied 5,172 customer support agents at a Fortune 500 software firm as an AI assistant was rolled out. Agents with the assistant resolved 15% more issues per hour on average, and less experienced, less skilled agents gained about 30%. The most experienced agents gained little, with small declines in quality. Customers were more polite and less likely to ask for a manager. (Peer-reviewed study.)
Notice what that study is about. The AI suggested replies to human agents; it never spoke to a customer on its own. It’s good evidence that AI can make a support team faster, especially newer staff. It isn’t evidence about a bot answering your customers unsupervised.
The biggest company claim: Klarna
The most quoted customer-facing example is the payments company Klarna. In its September 2025 filing with the US Securities and Exchange Commission, Klarna said its AI assistant handled 69% of customer service chats in the year to June 2025, did work equivalent to over 700 full-time agents, resolved queries in about two minutes against 12 for human agents, and delivered roughly $39 million in cost savings in 2024. (Company claim, in a regulatory filing.)
Two things to keep in mind. These are Klarna’s own numbers, from its own chat logs and satisfaction surveys, not an independent study. And the same filing says that, because some customers prefer people, Klarna continues to offer all of its customers a human option. Even the poster child for AI customer service kept the door to a person open.
The wider picture: no visible effect yet
At the level of whole economies, the effect is hard to find. A study of Danish workers by Anders Humlum and Emilie Vestergaard, linking survey answers to official earnings records, found what it calls precise null effects of AI chatbots on earnings and recorded hours, ruling out effects larger than 2%. That’s about staff using chatbots at work, not customer-facing bots, but it’s a useful check on the idea that the gains are already everywhere. (Working paper, National Bureau of Economic Research.)
The missing piece: small businesses
We looked for an official dataset, a peer-reviewed study or a vendor dataset with a published method on what a chatbot returns for a small or medium business. We didn’t find one. Every figure above comes from a company with thousands of staff or millions of customers, where a 15% productivity gain is worth millions. For a three-chair salon, the arithmetic is completely different: the question is whether the bot catches enough after-hours bookings and answers enough repeat questions to cover its cost, without losing the customers it frustrates.
That arithmetic is yours to do, and it’s not hard. Our breakdown of what a WhatsApp chatbot costs works through real monthly bills and cost per outcome, and the chatbot cost calculator does the sums with your own numbers.
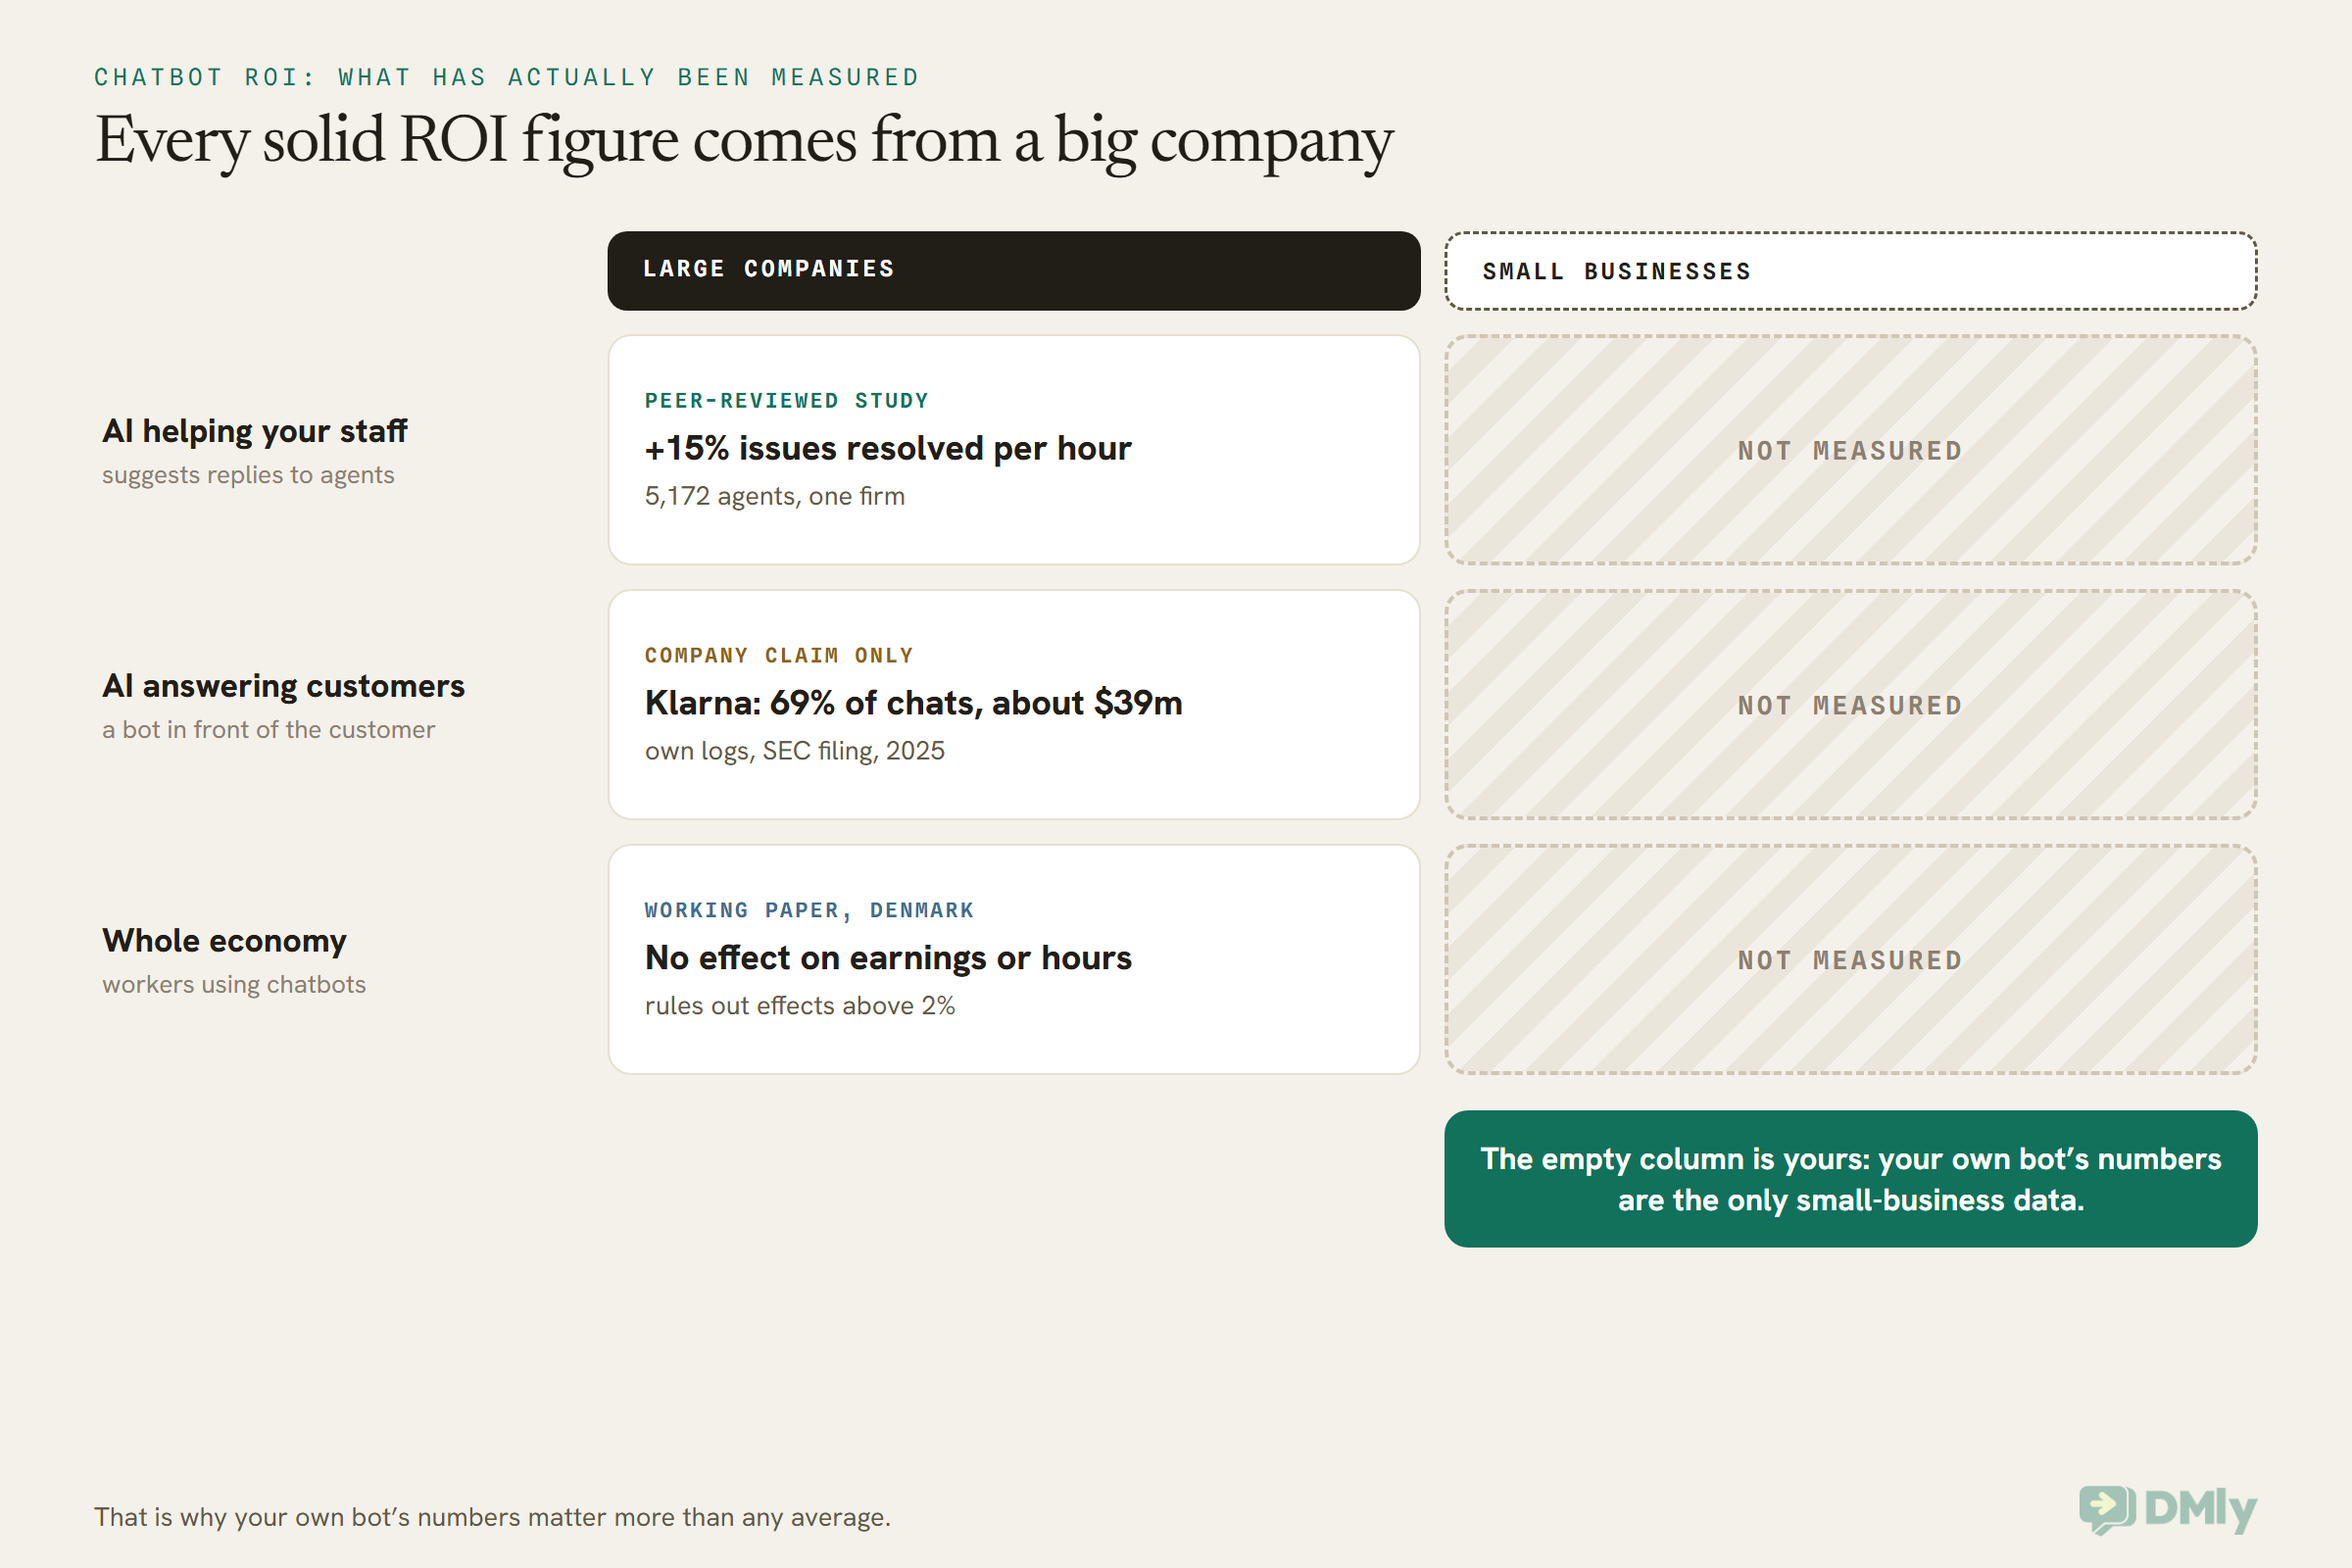
How solid is this?: Thin. One strong study (about AI assisting staff, not bots facing customers), one company’s claims, and no small-business data at all. If someone shows you a confident chatbot ROI percentage for a business your size, ask who measured it.
The Popular Chatbot Figures We Left Out, and Why
We left out any chatbot statistic we couldn’t trace to a source that states who was asked or counted, when, and how. Some of the most repeated numbers on the internet fail that test. Here are the ones you’re most likely to meet.
| You’ll see | Where it leads | Why it’s not on this page |
| “69% of consumers prefer chatbots for quick communication” | Usually credited to a 2018 vendor report; the original page now redirects to a product page | Can’t be read at source today, no method we could check, and eight years old |
| “Chatbots will save businesses $8 billion a year by 2022” | A 2017 Juniper Research press release | A forecast, not a measurement; method behind a paywall; the date has passed and nobody checked |
| “$11 billion and 2.5 billion hours saved by 2023” | A 2018 Juniper Research press release | Same: a forecast with an unpublished method, never verified |
| “Chatbots cut customer service costs by up to 30%” | A 2017 IBM blog post, which itself credits an online magazine | Second-hand at best; no study or sample behind it |
| “80% of people say chatbots increase frustration” | Often cited via a US government report, which took it from a 2022 vendor survey | We cite the vendor directly above where it’s useful, labelled, rather than as an official finding |
If a statistics page quotes these as fact, it hasn’t read the source. That doesn’t make the page useless, but it tells you how much checking went into the rest of it.
How to Measure Your Own Chatbot in DMly: The Only Chatbot Statistics About Your Business
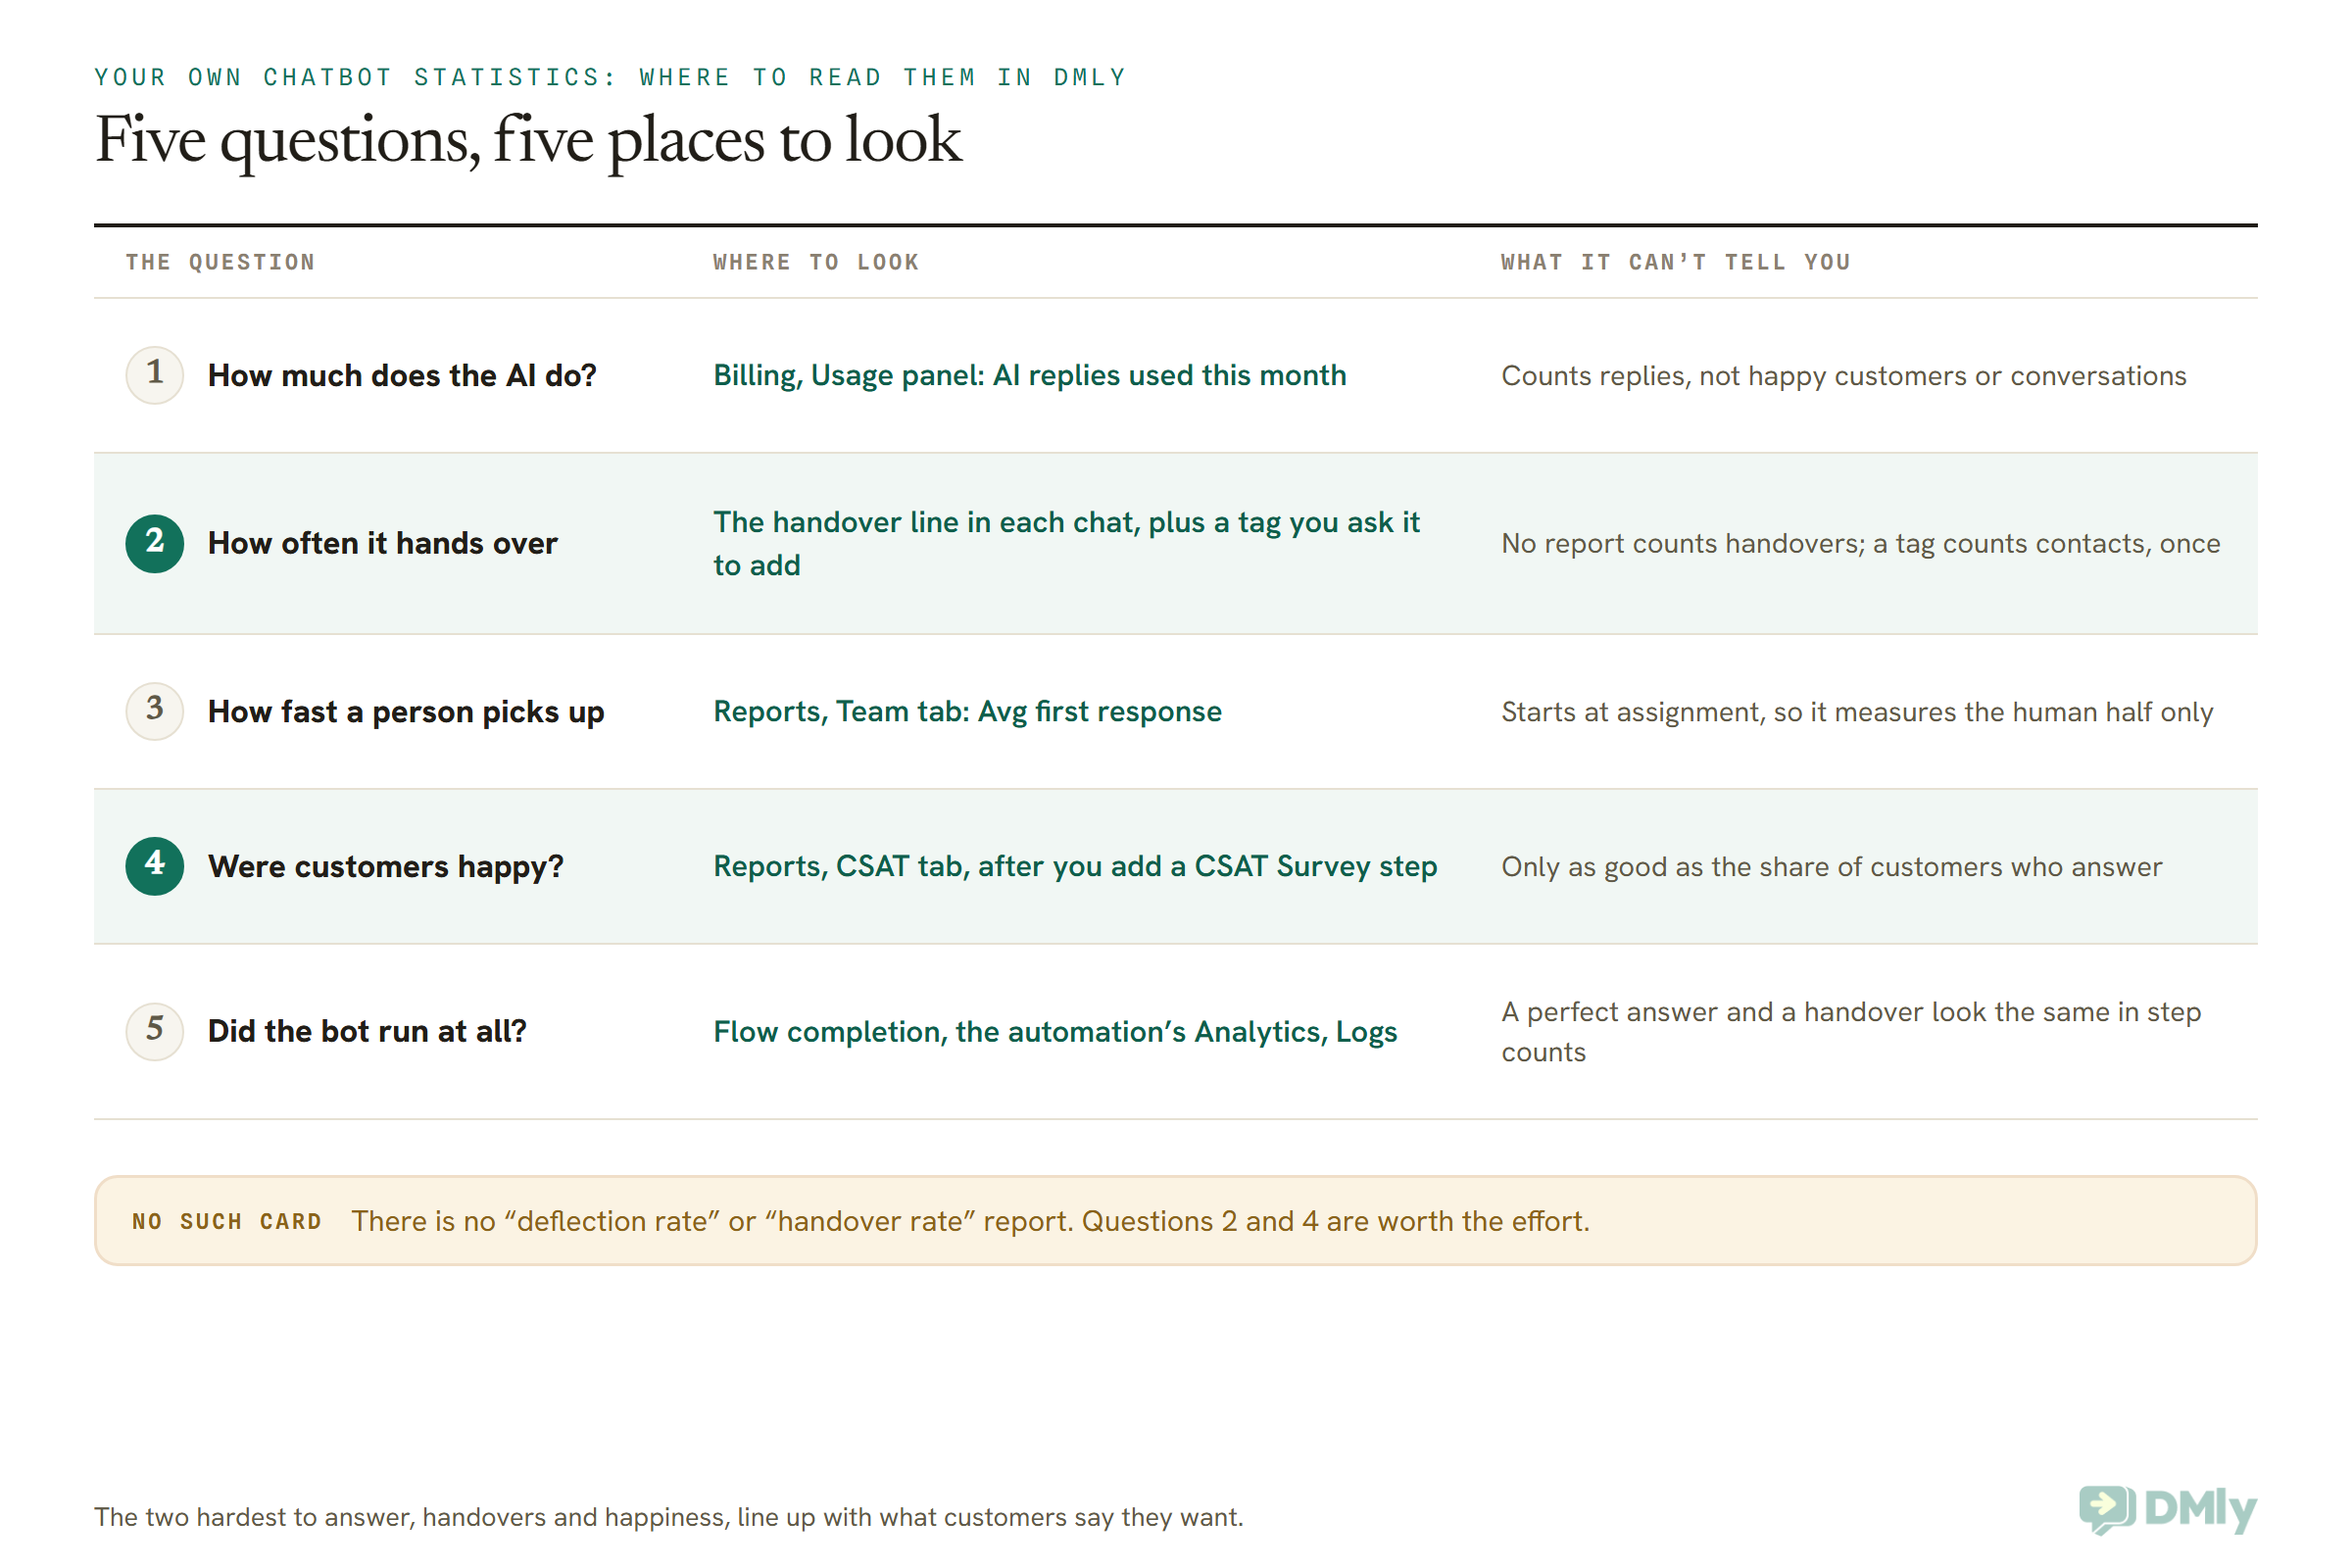
The chatbot statistics that matter most are the ones your own bot produces: how much it answers, how often it hands over, how fast a person picks up, whether customers were happy, and whether the flow ran at all. DMly gives you a place to read each of those. It doesn’t give you a single “deflection rate” or “handover rate” card, and it’s better to know that before you go looking.
Here are the five numbers worth checking once a month, and where each one lives.
1. How much the AI is doing
Open your workspace Billing page. The Usage panel has an AI replies row showing how many replies the shared AI has written this month against your plan’s allowance (500, 5,000 or 20,000 a month on the three plans; replies on your own connected AI key aren’t counted there). It’s a count of replies, not of customers or conversations, so treat it as a measure of workload rather than success.
Two things are worth knowing about it. When the allowance runs out, the next AI turn is skipped rather than failing, and a note in the conversation says the monthly limit was reached. And it resets at the start of each calendar month. If that note shows up in the last week of a busy month, your customers got silence from the bot, which is a statistic in itself.
2. How often it hands over, and why
This is the number most worth knowing and the hardest to get. When your AI agent uses its Hand over to a human tool, the bot pauses for that customer and a line appears in the conversation: 🙋 AI handed over to a human, followed by the reason the AI gave. There is no report that counts those lines for you.
Two practical ways round it:
- Read the reasons. Once a month, open a sample of handed-over conversations and write down the reasons. They are the most useful data your bot produces: each one is either a question it should learn to answer from better material, or a question it was right to pass on.
- Make handovers countable. Switch on the Add tags tool on the same AI Reply step and tell the agent, in its prompt, to add a tag such as
ai-handoverbefore it hands over. You can then filter Contacts by that tag. Tags sit on contacts, not conversations, so a customer handed over twice counts once, and because the AI is following an instruction rather than a rule, spot-check that it does it.
Our guide to pausing AI when a human agent takes over covers what happens to the bot during and after a handover, and when it picks the conversation back up.
3. How fast a person picks it up
The surveys agree on this more than anything else: customers want a human route, and they want it to be quick. In DMly, open Configurations → Reports, which opens on the Team tab. Avg first response is how long each teammate took to send their first reply after a conversation was assigned to them. Bot replies are never credited to a person, so this number measures the human half only.
That’s exactly what you want here. If your agent hands over with Auto-assign to an agent switched on, the clock starts at the handover. A bot that answers instantly and then hands over to a 40-minute wait has not made anyone’s day faster.
4. Whether customers were happy
Nothing in any report knows whether the AI’s answer was right. The only measurement in the product that asks the customer is a CSAT survey, which you add yourself: a CSAT Survey step in a WhatsApp flow, placed after the conversation ends, with a short delay. DMly even ships a ready-made automation, Post-chat CSAT → Google review, as a starting point. Before you publish it, check that every score reaches the review request, with unhappy ones going to a person first.
The results land on the CSAT tab of Reports: Response rate, Average score, Satisfaction (the share of answers in the top two points of the scale), Answered and Awaiting reply, with a score distribution and a daily trend. Want to compare bot-handled with human-handled conversations? Put the survey in both flows with different tags on each score path (the docs suggest tagging scores, for example csat-1 to csat-5), and compare the tagged contacts.
5. Whether the bot ran at all
The quietest failure is a bot that didn’t reply. Three places catch it:
- Overview: the Flow completion card (of the runs that finished, the share that completed rather than failing or being cancelled) and the Flow outcomes panel, where a climbing Failed count is your cue to look closer.
- The automation’s own Analytics, from the ⋮ menu on its row: runs, completions, failures and per-step counts.
- Logs, the last tab on Reports: filter to Automations and Warning to see bot starts that were suppressed, with the reason.
One honest limit: the AI Reply step has one way out, and a handover happens inside the step, so a run that ended in a perfect answer and a run that ended in a handover look the same in the per-step counts. Completion tells you the bot is running, not that it’s helping. That’s why numbers 2 and 4 matter more. Our AI customer service chatbot build guide walks through the knowledge base and testing that move those two numbers.
What the Evidence Means for Your Business
For most small businesses, the evidence points to a narrow, well-built bot with a fast route to a person, judged on your own numbers rather than anyone’s average. How that plays out depends on what your customers ask you.
- A salon or barber in the US or UK. Most messages are the same five questions: price, availability, location, parking, “can you fit me in?”. That’s the pattern where a bot earns its keep, as long as it reads real availability rather than guessing and hands over the moment someone asks about a colour correction or a complaint. Watch question 2: if a third of chats are handed over, the bot is missing material, not the customer.
- A clinic in India or the Gulf. Accuracy is the whole job. A bot that answers clinic hours and booking questions is useful; one that answers a symptom question is a liability. Here the 87% who want a person is your design brief: anything clinical goes to a human straight away, and the handover reasons are what you review each month.
- A restaurant in Nigeria or Southeast Asia. Evening rushes bring a flood of “are you open?”, “do you deliver to…?” and “table for four?” messages at the exact moment nobody can type. That’s where speed genuinely helps. But the “leaky bucket” applies: a bot that confirms a table you don’t have loses that customer for good.
- An online shop anywhere. Order-status questions are repetitive and easy to answer from your own records, which is closest to the conditions in the big-company evidence. Refunds and complaints are not, and the Air Canada ruling is a reminder of who pays when the bot invents a policy.
If you haven’t built one yet, our WhatsApp AI chatbot guide for small businesses starts with a simple test: count last week’s messages and sort them into “needed a person” and “needed an answer”. The second pile is your case for a bot, measured in your own numbers. Our guide to messaging automation metrics covers the wider set of numbers to watch once it’s live.
Frequently Asked Questions
What are the most reliable chatbot statistics for 2026?
The official ones. The US Census Bureau found 23.8% of US businesses used AI in some function in the two weeks to 4 October 2026, and 7.6% used AI for customer service over winter 2025 to 2026. Eurostat found 19.95% of EU businesses with ten or more staff used AI in 2025. Statistics Canada is the only official source that names chatbots: 28.2% of Canadian businesses using AI used it for virtual agents or chatbots in 2026.
What percentage of businesses use chatbots?
For AI chatbots in customer service specifically, the best official figures suggest somewhere around one business in twenty: 7.6% of US businesses used AI for customer service in the six months to early 2026, and our arithmetic on Statistics Canada’s figures gives about 5% of Canadian businesses using chatbots. Figures of 20% to 30% you’ll see quoted are for AI of any kind, which includes staff using AI tools for writing and admin.
Do customers prefer chatbots or humans?
Humans, on balance. 47% of US adults told Pew that AI would do customer service worse than people, against 19% better, and 64% of customers in a Gartner survey said they’d prefer companies didn’t use AI for customer service. But about half (49%) said they would have used a chatbot on their last service contact if one had been offered, so a good bot with a clear route to a person is acceptable to many customers.
Is there reliable data on chatbot ROI?
Not for small businesses. The strongest study found support agents helped by AI resolved 15% more issues per hour at one large firm, and Klarna claims its AI assistant saved about $39 million in 2024, but nobody has published a transparent measurement of what a chatbot returns for a small or medium business. Work out your own from your message volume, your plan cost and the bookings or sales the bot handles.
What do customers want most from a customer service chatbot?
A way to reach a person and answers that are right. 87% of customers in Gartner’s 2026 survey said access to a human agent is essential when companies use AI in customer service, and the top concerns about AI customer service were that it would be harder to reach a person (60%) and that it would give wrong answers (42%).
Why do chatbot statistics online disagree so much?
Because they measure different things. Some count AI of any kind, some count customer service only; some survey businesses with ten or more staff, some include sole traders; and many popular figures are old forecasts or vendor surveys with no published method. Check what was counted, out of whom, when and by whom before you compare two numbers.
What should I measure on my own chatbot?
Five things: how much the AI answers, how often it hands over and why, how fast a person picks up after a handover, whether customers rate the conversation well, and whether the bot ran at all. In DMly those live on the Billing usage panel, in the handover note on each conversation, on the Team and CSAT reports, and in Flow completion, the automation’s Analytics and Logs.
The Question, Answered Again: Using Chatbot Statistics Well
Go back to the question at the top. Would you prefer that companies didn’t use AI for their customer service?
If you said yes, you’re with the 64%. But think about what you were picturing: probably a bot that wouldn’t let you reach anyone, or that confidently got something wrong. That’s exactly what the evidence says customers hate. Change the picture to a bot that answers your price question at 11pm and passes you to a person the moment you need one, and plenty of people, half of Gartner’s 2026 sample, would use it.
That’s the real lesson of chatbot statistics in 2026. Adoption is lower than the headlines, customer patience is shorter, and the ROI evidence for a business your size doesn’t exist yet. None of that is a reason not to build one. It’s a reason to build it narrowly, keep a person one message away, and judge it on the only chatbot statistics that describe your business: the ones your own bot produces, starting this month.
Writing about WhatsApp automation, bookings and growth for local business.
Turn WhatsApp into your busiest channel.
Start free and run message, bookings, payments and reviews in one place.
