
Pick up any packet of food and the nutrition label does something most appointment no-show statistics never do: it tells you what the number is per. Not just “12 grams of sugar”, but 12 grams per 100 grams, or per serving, so you can compare one packet with another without being fooled.
No-show figures get passed around without that line. One article says the average is 23%. Another says 5%. A third says salons lose one client in five. They can all be quoted accurately and still tell you nothing about your own diary, because each one was counted in a different place, out of a different total, by a different person, in a different year.
So this page puts the label back on. In this guide, we’ll go industry by industry through every no-show rate we could trace to a named study or an official dataset, each with its source, setting, sample and year, and a plain confidence rating. We’ll show you where the figures agree, be honest about the industries (salons and gyms among them) where no reliable number exists, and then show you how to measure your own rate in DMly, which is the only figure that really describes your business.
Appointment No-Show Statistics at a Glance
There is no single average no-show rate. Published appointment no-show statistics run from under 1% to over 50%, and most of that spread comes from the setting and how the counting was done, not from the customers. Large official datasets in England put GP and hospital outpatient no-shows at about 4% to 6%. Reviews of research studies land far higher, around 13% to 23%, partly because researchers tend to study clinics that already have a problem.
Here is the whole picture in one table. Each row is expanded in its own section further down.
| Industry | Best-sourced range | Confidence | Strongest source |
| GP and primary care | About 4% (England, official) to 25% (one US safety-net system, in person) | High for England; medium elsewhere | NHS England, August 2026 |
| Hospital outpatients and specialist clinics | About 5% (England, official) to 18% (one paediatric eye service) | High for England; medium elsewhere | NHS England, 2025-26 |
| Imaging (X-ray, CT, MRI, mammography) | About 1% to 7%, depending on the scan | Medium | One US academic system, 2.9 million exams |
| Mental health clinics | About 1 in 3 first appointments missed (wide uncertainty) | Medium to low | 2026 meta-analysis, 35 studies |
| Dental | About 14% to 15% in hospital and university clinics; higher for teenagers | Low (nothing for ordinary practices) | Two clinic studies, UK and US |
| Physiotherapy | About 11% to over 50% | Low | US military clinics; one Nigerian clinic |
| Restaurant reservations | About 0.5% to 6% by country, 2.3% overall | Medium (vendor data) | Resos No-Show Index 2026 |
| Salons and barbers | No reliable figure | None | None published with a method |
| Gyms and fitness classes | No reliable figure | None | None published with a method |
If you only take one thing from this page: don’t plan your business around somebody else’s average. Count your own month first. You’ll find out how further down.
How to Read a No-Show Rate (and How We Rated Each Figure)
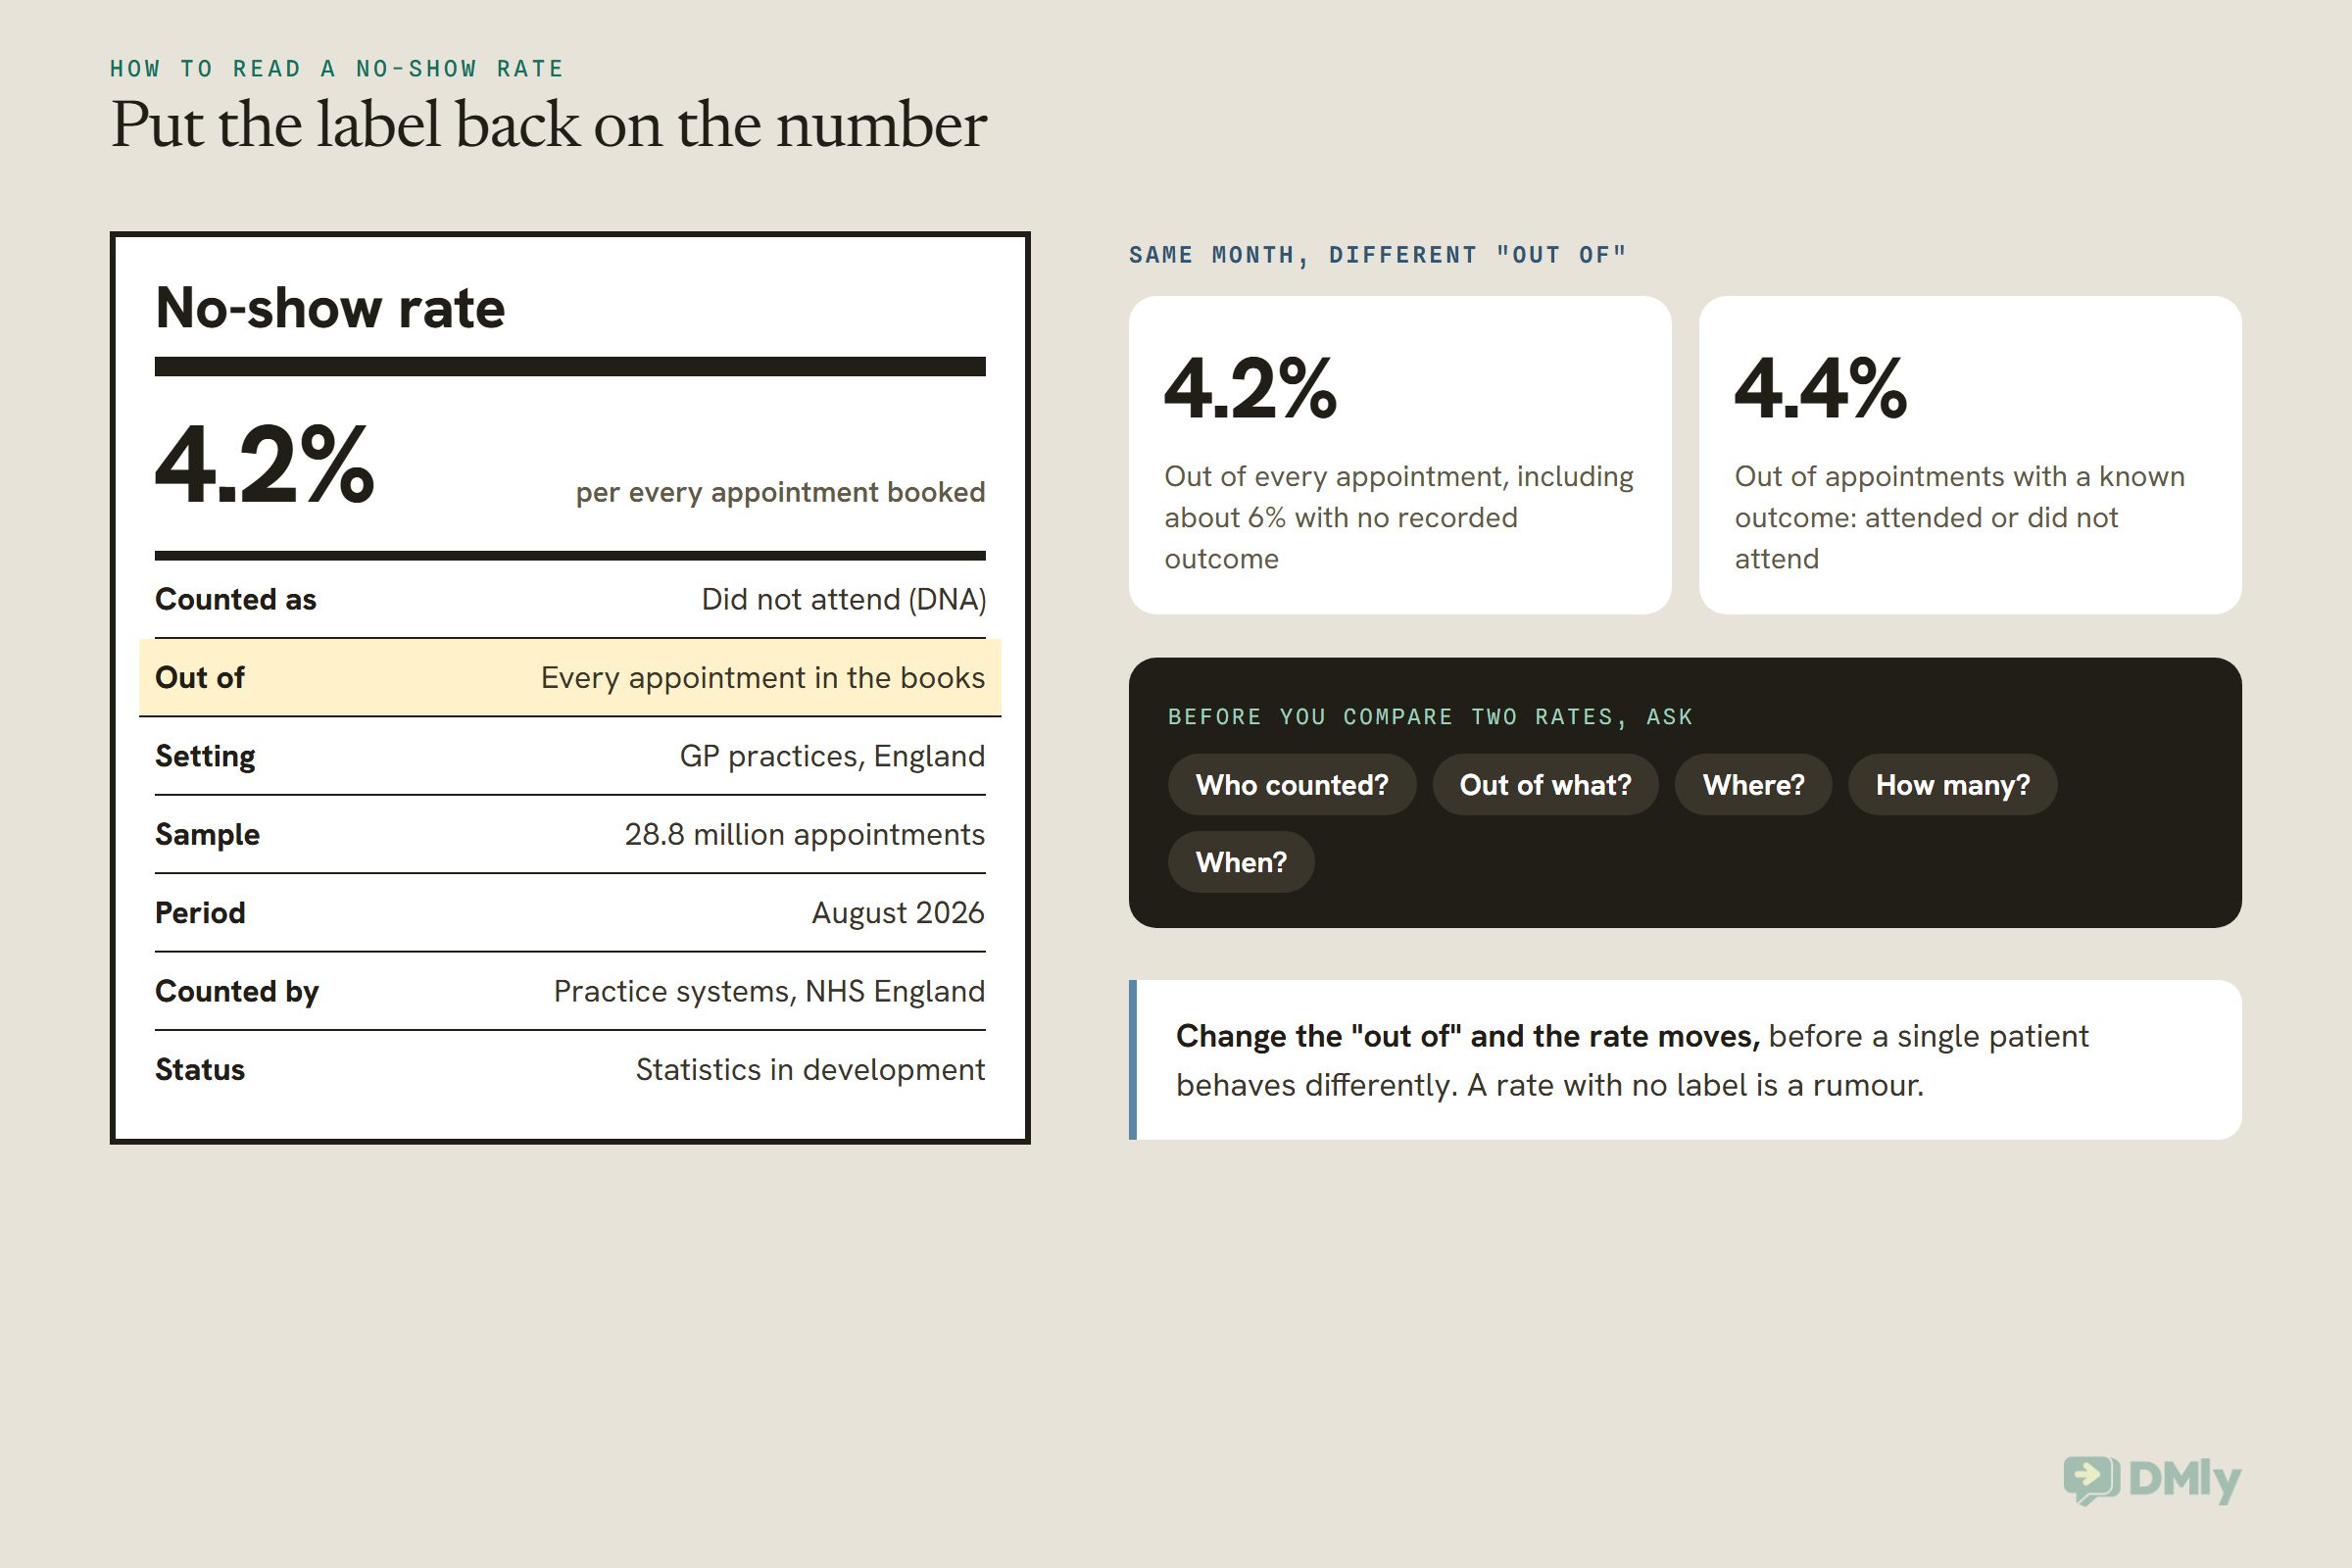
A no-show rate is only meaningful with its label: what was counted, out of what total, where, how many appointments, when, and who did the counting. Change any one of those and the number moves, sometimes a lot.
Take the most solid figure on this page. In August 2026, GP practices in England recorded about 1.2 million appointments where the patient did not attend, out of 28.8 million in the appointment books. That’s 4.2%. But roughly 6% of those appointments have no recorded outcome at all. Count only the appointments where somebody wrote down what happened, and the same month reads 4.4%. Same patients, same practices, different “per”.
Every figure below gets a confidence rating on the same four-step scale:
- High: an official dataset or a very large count of real recorded outcomes, with a published method, from the last few years.
- Medium: a peer-reviewed study or review with a stated sample, but limited to one organisation, one country, older data or mixed settings. A vendor dataset that publishes its sample, period and definition also tops out here, and is labelled as vendor data.
- Low: a single clinic, a small sample, or a pooled figure where the studies disagree wildly.
- None: we could not find any figure that clears the bar, so we don’t print one.
We use a similar trust key on our WhatsApp business statistics page, for the same reason: a number with no label is a rumour.
GP and Primary Care No-Show Rates
The best-measured primary care no-show rate in the world is England’s, at about 4% of GP appointments a month. Research studies of primary care elsewhere average about 13% to 15%. Both are true. They just measure different things.
| Figure | Source, setting and sample | What it does and doesn’t tell you | Confidence |
| 4.2% of GP appointments not attended (about 1.2 million) | NHS England, Appointments in General Practice, August 2026 (published 24 Sep 2026). All practices submitting data, 28.8 million appointments. Our calculation from the published CSV. | A whole national system, every month. It counts all appointment types, including same-day and phone. About 6% of appointments have no recorded outcome, and NHS England labels these “statistics in development”. | High |
| 4.1% to 5.1% a month, March 2024 to August 2026 | Same dataset, 30 months. | The rate is steady. October was the highest month in both 2024 and 2025 (about 5.1%). It doesn’t explain why. | High |
| 3.2% to 5.5% by region | Same dataset, August 2026. Lowest East of England, highest London. | Even inside one health system, place moves the rate by more than half again. It doesn’t say which local factors cause it. | High |
| Mean 15.2%, median 12.9% | Parsons, Bryce and Atherton, systematic review, British Journal of General Practice, 2021. 19 primary care studies that reported a rate. | What research studies of primary care find, across countries. Studied clinics are often ones with a known problem, which pushes the average up. | Medium |
| 25% in person vs 12% by telemedicine | Ojinnaka and colleagues, American Journal of Preventive Medicine, 2024. One US safety-net academic health centre, 474,212 appointments, March 2020 to December 2022. | A high-need US population, where telemedicine roughly halved missed appointments. It doesn’t describe an average US practice. | Medium |
| 19% of patients missed more than two appointments in three years | Ellis and colleagues, Lancet Public Health, 2017. Scotland, 550,083 patients, 2013 to 2016. | No-shows cluster in a minority of people. It describes patients, not a per-appointment rate. | High |
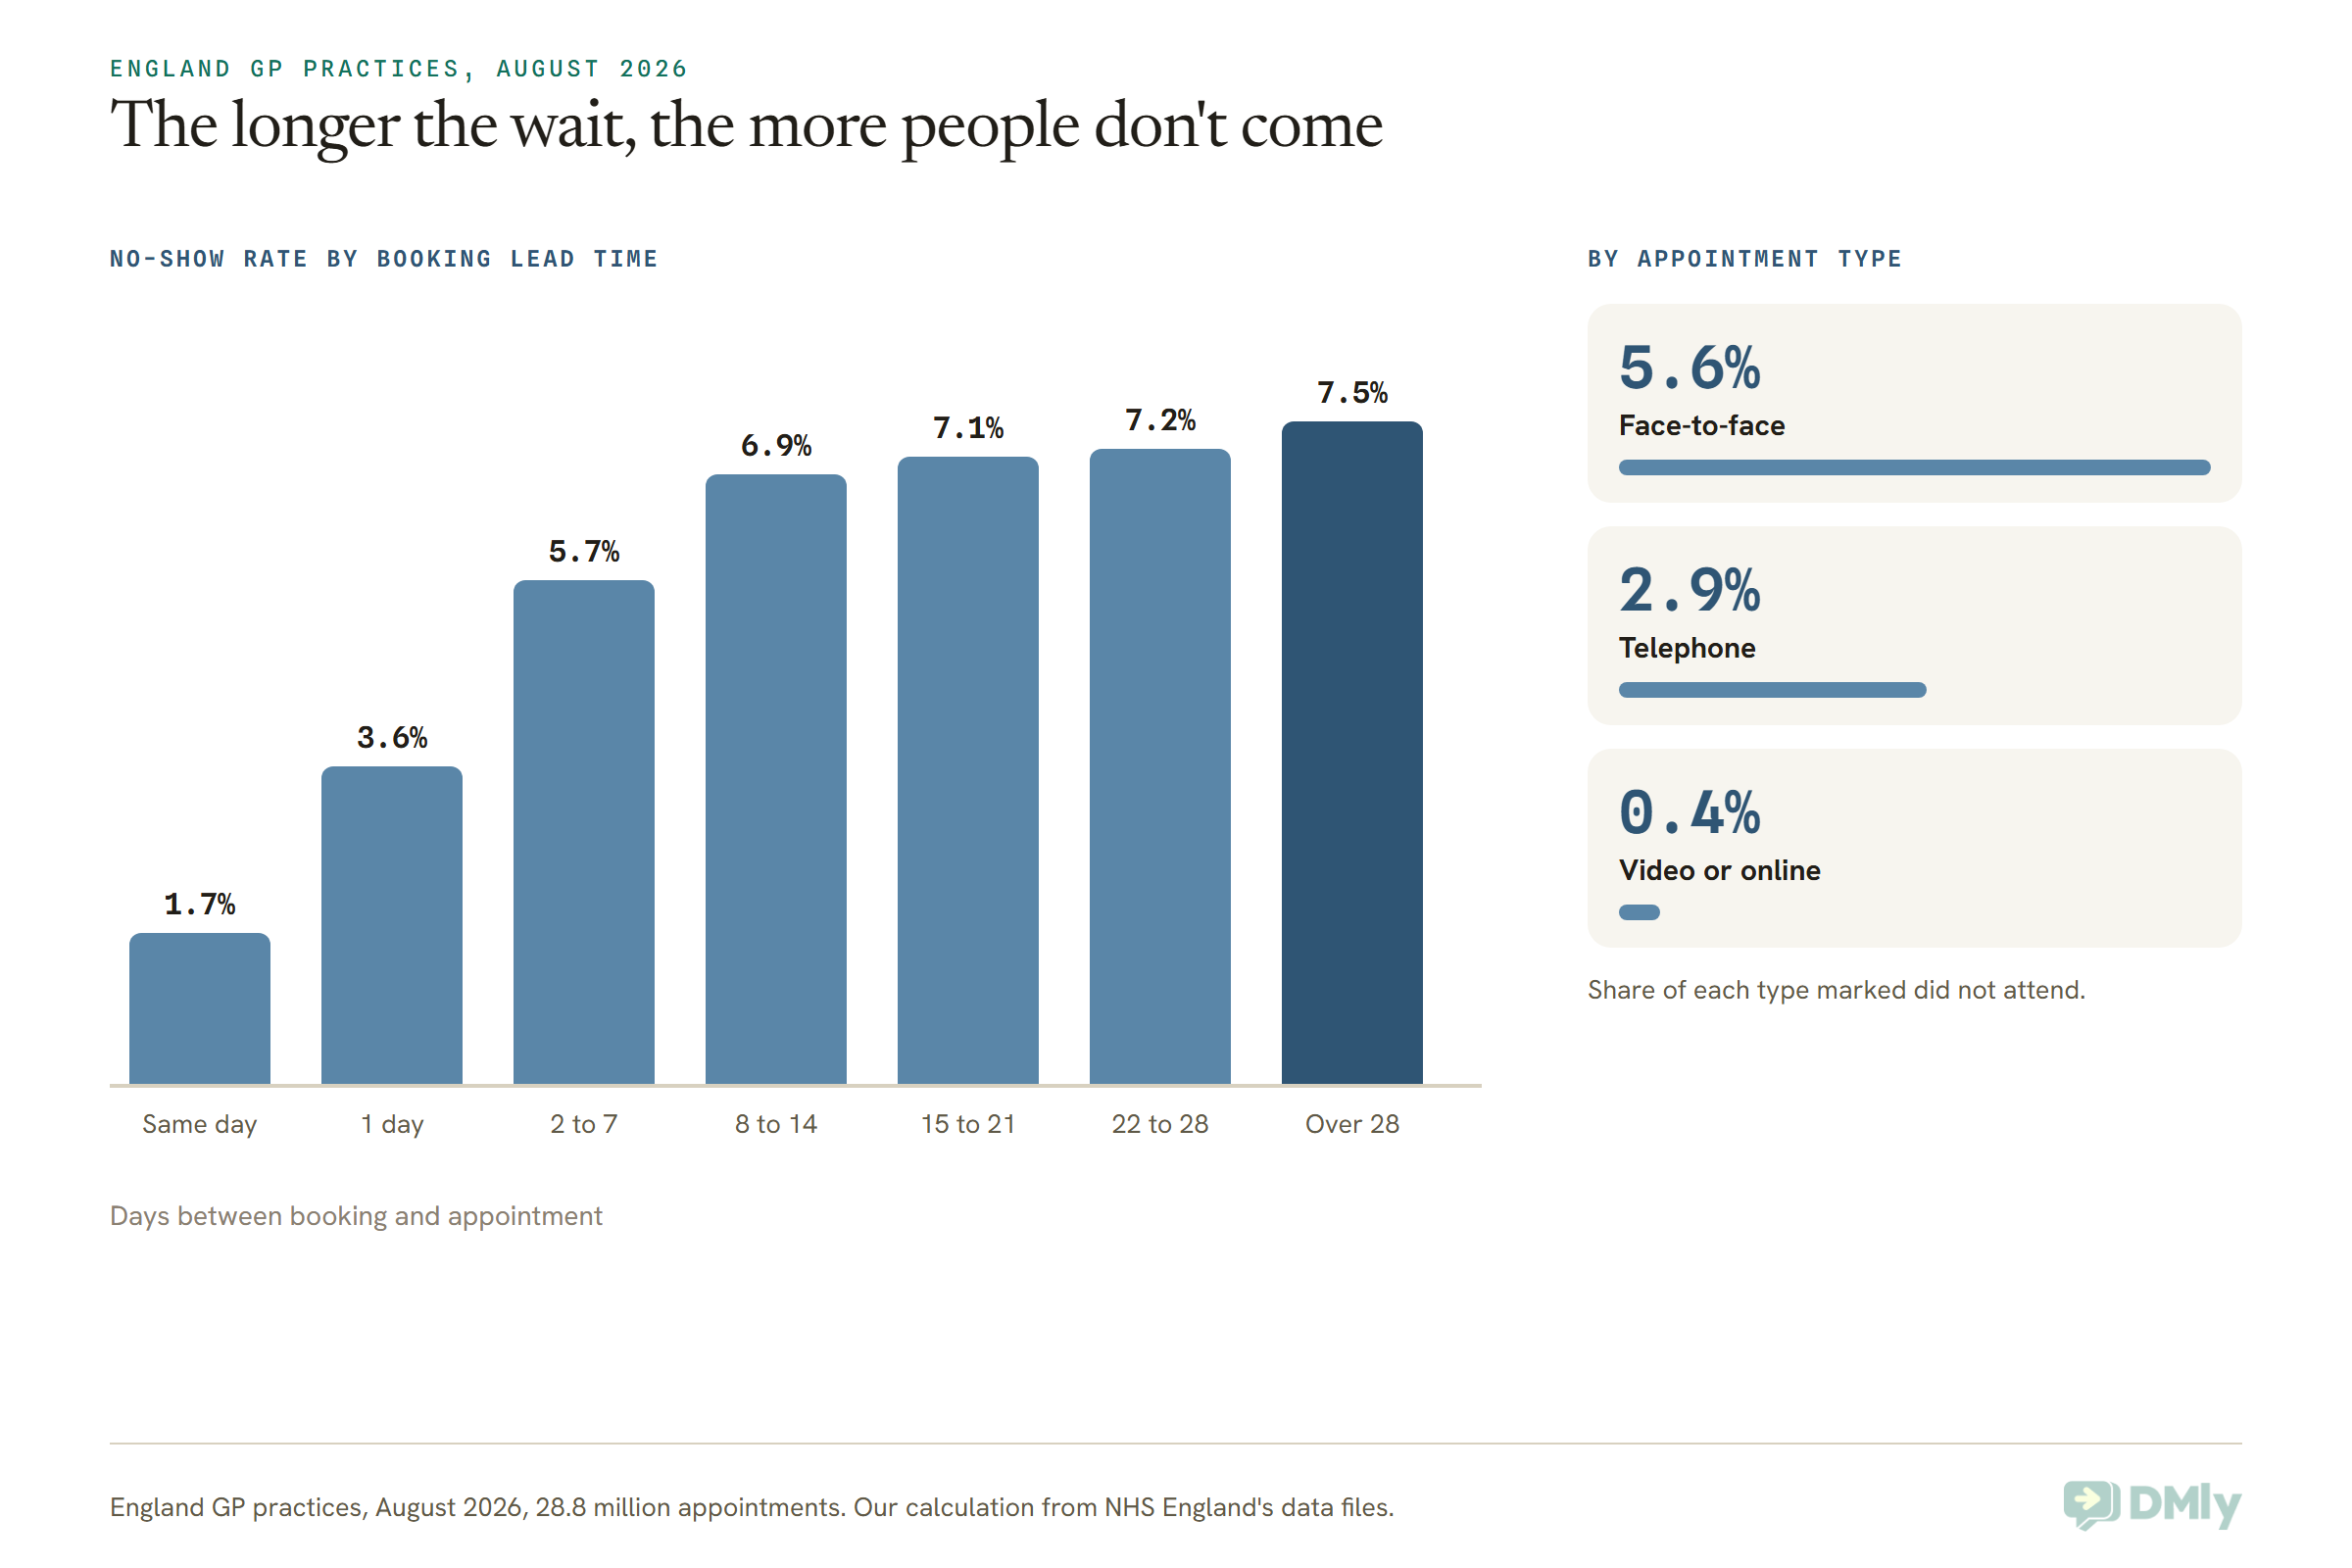
Two details in the English data are worth knowing even if you don’t run a GP surgery. Appointments with a GP were missed less often (3.0%) than appointments with other practice staff such as nurses (5.2%). And the type of appointment mattered a great deal: 5.6% of face-to-face appointments were missed, 2.9% of phone appointments and 0.4% of video or online ones. We come back to that in the patterns section.
If you run a clinic, our guide to how clinics can reduce appointment no-shows with WhatsApp turns these patterns into a front-desk routine.
Hospital Outpatient and Specialist Clinic No-Show Rates
England’s hospitals recorded 8.2 million missed outpatient appointments in 2025-26, about 5.4% of all outpatient appointments. Single hospitals studied elsewhere report anything from about 6% to about 18%, depending on the specialty and the patients.
| Figure | Source, setting and sample | What it does and doesn’t tell you | Confidence |
| 5.4% of outpatient appointments were DNAs (8.2 million), down from 6.2% in 2019-20 | NHS England, Hospital Outpatient Activity 2025-26 (published 24 Sep 2026, accredited official statistics). All NHS hospitals in England, 150.3 million appointments. | A national count that has fallen since before the pandemic. The total includes appointments cancelled in advance, so the rate among appointments that actually went ahead is a little higher. | High |
| About 23% on average; 43.0% in African studies, 13.2% in Oceania | Dantas and colleagues, systematic review, Health Policy, 2018. 105 studies across all medical specialties. | The range research finds in clinics worldwide, and that long lead times and past no-shows are the most common drivers. Studied clinics are not a random sample of all clinics, so it is not a benchmark. | Medium |
| 11.3% | AlMuhaideb and colleagues, Annals of Saudi Medicine, 2019. One tertiary hospital in Riyadh, 1,087,979 outpatient appointments in 2014. | A large Gulf dataset. Past no-shows were the strongest predictor of the next one. It is one hospital, and the data is now more than ten years old. | Medium |
| 6.4% of telemedicine appointments | Rodriguez-Zea and colleagues, Journal of Public Health Policy, 2026. Peru’s social health insurer, 538,312 telemedicine appointments, 2023 to 2024. | Even remote appointments get missed, with young adults, morning slots and end-of-week days worst. It covers telemedicine only. | Medium |
| 18.3% | Law and colleagues, Journal of AAPOS, 2023. One Canadian hospital’s paediatric eye and adult strabismus service, 3,922 visits, 2018 to 2019. | New patients and people with earlier no-shows missed more. One small specialist service, so treat it as a single data point. | Low |
The pattern to notice is not the spread, it’s the predictor. The Riyadh hospital, the Canadian eye service and the Scottish GP data all point at the same thing: the person most likely to miss their next appointment is the person who missed the last one.
Imaging and Diagnostic Appointment No-Shows
Scans are missed less often than consultations: about 2% to 3% overall in the largest study we found, but with a five-fold spread between scan types.
| Figure | Source, setting and sample | What it does and doesn’t tell you | Confidence |
| 3.4% (2000) falling to 2.3% (2015) | Rosenbaum and colleagues, Journal of the American College of Radiology, 2018. One US multi-hospital academic system, 2,893,626 outpatient imaging visits over 16 years. | A very large count of real outcomes. One institution, and the most recent year is 2015. | Medium |
| 7.0% for mammography vs 1.3% for plain X-ray | Same study. | Screening appointments people book for “later” get missed far more than tests they need now. Bookings more than six months ahead did worse than those within a week. | Medium |
The same study found Mondays and Saturdays had more no-shows than Sundays. Keep that in mind: Monday turns up again in a completely different industry below.
Mental Health and Therapy No-Show Rates
Mental health clinics have some of the highest no-show rates in healthcare: a 2026 meta-analysis puts missed first appointments at about one in three. The uncertainty is wide, so read it as “high” rather than as an exact figure.
| Figure | Source, setting and sample | What it does and doesn’t tell you | Confidence |
| 34% of first appointments missed (likely range 24% to 45%); 42% at the second | Kuppili and colleagues, systematic review and meta-analysis, Psychiatric Services, 2026. 35 studies of general (non-specialist) outpatient mental health clinics. | Missed appointments are common and rise with later appointments. The studies disagree a lot with each other, so the pooled number is a rough centre, not a benchmark for a private therapist. | Medium to low |
| More than 8 times the risk of death among patients with long-term mental health conditions who missed more than two GP appointments a year | McQueenie and colleagues, BMC Medicine, 2019. Scotland, 824,374 patients, 2013 to 2016. | Not a no-show rate, but the reason a missed appointment in health care can be a welfare signal rather than a lost fee. It shows an association, not a cause. | High |
If you run a therapy practice, that second row matters more than the first. A repeat no-show may need a phone call from a person, not an automated fee.
Dental No-Show Statistics
The dental no-show figures we could verify all come from hospital and university clinics, where about one appointment in seven is missed. We found no reliable figure for ordinary high-street or private dental practices.
| Figure | Source, setting and sample | What it does and doesn’t tell you | Confidence |
| 14.5% of new-patient appointments | Rodriguez and colleagues, Journal of Dentistry, 2025. Guy’s and St Thomas’ dental hospital, London, over 40,000 referrals in 2022. | Patients waiting more than 180 days had about ten times the odds of missing as those waiting under 30. It covers referred hospital patients, not routine check-ups. | Low for practices; medium for hospital clinics |
| 14.3% overall; 24% for ages 12 to 17 | de Oliveira and colleagues, International Journal of Dentistry, 2025. A university dental clinic in Buffalo, New York, 7,379 visits by under-20s, 2018 to 2023. | Teenagers are the hardest group to get through the door. One academic clinic serving many deprived families. | Low |
If you run a private practice, your rate could be far lower than these, or not. The only way to know is to count. Our guide to automating dental appointment reminders covers the reminder side for practices.
Physiotherapy and Rehab No-Show Rates
Physiotherapy no-show rates range from about 11% in a large US dataset to over 50% in one Nigerian clinic, which mostly tells you how much the setting matters.
| Figure | Source, setting and sample | What it does and doesn’t tell you | Confidence |
| 11.1% (8.4% to 14.9% by clinic) | Baker and colleagues, Military Medicine, 2020. US military physical therapy clinics around Washington, DC, 182,134 appointments over one year. | A large count. New patients booked more than 20 days out were lost far more often. Military patients are not a typical private physio caseload. | Medium |
| 52.5% of booked appointments missed | Fatoye and colleagues, Annali di Igiene, 2024. One outpatient physiotherapy clinic in Nigeria, 3,243 appointments, 2009 to 2019. | Shows how bad it can get when travel and cost are real barriers. One clinic over ten years, not a national rate. | Low |
Restaurant Reservation No-Shows: The Best Non-Medical Dataset
The most transparent no-show dataset outside healthcare that we found is a restaurant one: 2.33% of 3.77 million reservations, published by a booking software company with its full method. A table booking isn’t an appointment, but the behaviour is close enough to be useful, especially for anyone in hospitality.
| Figure | Source, setting and sample | What it does and doesn’t tell you | Confidence |
| 2.33% of reservations | Vendor data. Resos No-Show Index 2026 (published 19 Aug 2026). 2,417 restaurants using Resos, 3,768,761 reservations, August 2025 to July 2026. No-shows are statuses staff recorded, out of no-shows plus attended bookings. | A real recorded count with a published definition. Resos’s customers are not a random sample, and the UK is 54% of bookings. Resos itself says the true rate is likely somewhat higher, because staff don’t always mark no-shows. | Medium (vendor) |
| 3.17% US, 1.48% UK, 5.88% France, 0.49% Switzerland | Same dataset, 12 countries. | Countries differ, but Resos warns the gaps may reflect restaurant mix and recording habits, not just diners. | Medium (vendor) |
| 0.80% with a card or payment requirement vs 2.47% without | Same dataset. | Descriptive only. Restaurants that take deposits differ from those that don’t, and Resos’s own matched analysis found no estimate it treats as a reliable effect. | Low as evidence for deposits |
| About 16% lower no-show rate where an SMS reminder was delivered | Same dataset, compared within the same restaurants. | An association, not a proven cause. Confirmation prompts showed almost no association. | Low to medium |
Notice how low the headline is next to healthcare. A dinner booking is usually made for something people want to do, a few days ahead. A check-up is often booked weeks ahead for something they’d rather avoid.
Salons, Barbers, Gyms and Other Industries With No Reliable No-Show Figure
We could not find a single salon, barber or gym no-show rate that names its sample and method, so we don’t print one. That’s an uncomfortable answer on a page of appointment no-show statistics by industry, but filling the gap would mean passing on a number nobody can check.
Here’s what is out there, and why it didn’t make the cut:
- Salons and barbers. Booking platforms have published figures, but the ones we read don’t say how many businesses or bookings they counted, over what period, or whether late cancellations were bundled in. One widely repeated “measured” salon figure we could only find second-hand, with no original to read. Some vendor numbers count no-shows only; others fold in late cancellations. They aren’t comparable with each other, let alone with your salon.
- Gyms and fitness classes. The class no-show figures that circulate sit on statistics roundup sites that credit them to other organisations without a link to an original report. We couldn’t trace any of them to a published sample and method.
- Vets, tutors, accountants, lawyers and consultants. We found no published dataset with a method at all.
- Whole countries. We found no national no-show figure for India or Nigeria. The 2018 systematic review in the hospital section reports the highest average in Africa (43%) and the lowest in Oceania (13.2%), but those are averages of research studies, mostly in clinics, not national rates.
The honest benchmark for a salon, barber, studio or tutor is the one you make yourself. Our guide on how salons can reduce no-shows with deposits and WhatsApp reminders starts exactly there: find your real rate before choosing a fix.
What Appointment No-Show Statistics Agree On Across Industries
The rates disagree, but the patterns behind them line up remarkably well: the longer the wait, the higher the no-show rate; past no-shows predict future ones; younger adults miss more; and appointments people can join from home are missed far less. These patterns are more useful to you than any average, because they tell you where to act.
1. The further ahead the booking, the likelier the no-show
This is the strongest pattern in the whole field. In England’s GP data for August 2026, same-day appointments were missed 1.7% of the time. Book two to seven days ahead and it was 5.7%. Book more than four weeks ahead and it was 7.5%, more than four times the same-day rate.
The same shape appears elsewhere. In the US military physio clinics, 16% of new patients seen within 10 days didn’t show or cancelled, against 28% of those seen 21 to 30 days later. In the London dental hospital, a wait of more than six months came with about ten times the odds of a missed new-patient appointment. The 2018 systematic review of 105 studies named long lead time as one of the two most commonly reported determinants of a no-show.
One honest exception: restaurant bookings barely follow it. In the Resos data, same-day reservations were missed 2.09% of the time and bookings made 30 or more days ahead 1.96%. A dinner booked a month ahead is usually an occasion, not an obligation.
2. The best predictor of a no-show is the last no-show
The Riyadh hospital study ranked a patient’s no-show history as the single most informative factor, far ahead of age, day or time. The 2018 review found the same. In Scotland, 19% of patients missed more than two GP appointments in three years. For your business, that means a no-show problem is often a small-group problem, which changes what you do about it.
3. Younger adults miss more
The 2018 review, the 2021 primary care review and the Peruvian telemedicine study all found younger adults more likely to miss. In the Buffalo dental clinic, teenagers missed nearly one appointment in four. It’s not that young people don’t care. Work, childcare and travel barriers were the most common reasons people gave in the primary care review, alongside simply forgetting.
4. Appointments people don’t have to travel to are missed far less
In England, video and online GP appointments were missed 0.4% of the time against 5.6% face to face. In the US safety-net system, telemedicine missed appointments ran at about half the in-person rate. Remote appointments still get missed (6.4% in Peru’s national telemedicine service), but travel is clearly part of the story.
5. Mondays are hard
A small one, but it shows up in two unrelated datasets. Imaging appointments in the US study were missed more on Mondays and Saturdays than Sundays. In the Resos restaurant data, Monday had the worst no-show rate of the week.
What Reduces No-Shows: The Evidence, Rated the Same Way
Reminders are the only no-show fix backed by randomised trials across many settings: they cut missed appointments by roughly a quarter to a third in healthcare trials. The evidence for deposits, fees and confirmation requests is much thinner, and we’ll say so.
| Fix | What the evidence shows | Source | Confidence |
| Text reminders | Attendance rose from 67.8% with no reminder to 78.6% with a text reminder. Text reminders worked about as well as phone calls and cost 55% to 65% less per attendance in two studies. | Cochrane review, Gurol-Urganci and colleagues, 2013. 7 randomised trials, 5,841 people. | Medium to high (the review rates its evidence low to moderate) |
| Text notifications | No-shows fell from 21% to 15%, about 25% fewer. More than one notification worked better than one. | Robotham and colleagues, BMJ Open, 2016. 21 studies, about 16,000 patients. | Medium to high |
| Reminder wording | A reminder that stated what a missed appointment costs the hospital cut the missed rate from 11.1% to 8.4%. Saying the same thing in general terms was weaker. | Hallsworth and colleagues, PLOS ONE, 2015. Two randomised trials at one NHS hospital trust in England, about 20,000 patients. | Medium |
| Shorter booking gaps | Same-day and next-day appointments were missed far less than those booked weeks ahead. | NHS England GP data, 2026; Baker and colleagues, 2020. | High as a pattern; not a trial |
| Remote option | Video or online appointments were missed much less than in-person ones. | NHS England GP data, 2026; Ojinnaka and colleagues, 2024. | Medium; not a trial |
| Deposits | Restaurants requiring payment had lower no-show rates, but the source itself declines to call that an effect. | Resos No-Show Index 2026 (vendor). | Low |
| Asking customers to confirm | Confirmation prompts showed almost no association with fewer restaurant no-shows. | Resos No-Show Index 2026 (vendor). | Low |
| No-show fees | We found no trial or transparent dataset on fees for salons, clinics or studios. | None | None |
One caveat that matters for WhatsApp users: every trial above tested SMS text messages, not WhatsApp. WhatsApp reminders are the same idea delivered in an app your customers already have open, and there’s every reason to expect them to work at least as well, but no published trial has tested them yet. We won’t pretend otherwise.
What about deposits and asking people to confirm? Absence of evidence isn’t evidence they don’t work. They do something reminders can’t: a deposit makes a slot cost something to abandon, and a two-way reminder turns a silent no-show into a cancellation you can refill. Just don’t expect a published percentage to quote at your customers.
How to Measure Your Own No-Show Rate in DMly
Your own no-show rate is the only appointment no-show statistic that describes your business, and in DMly it’s on the Appointment reports page. Here’s how to read it, and how to make sure it’s telling the truth.
- Open the report. Go to Configurations, then Reports, then the Appointments tab. The page is headed Appointment reports. Five cards run across the top: Total bookings, Completed, No-show rate, Revenue (paid) and Avg class fill.
- Pick a full month. Set From and To to a whole month, so one quiet week doesn’t distort the picture. The cards and both tables follow the filter.
- Read it by service and by staff. The By service and By staff tables show bookings, completed and no-shows row by row. A rate is rarely even, and the service with the worst rate is usually where your effort pays most.
- Download the CSV once. CSV gives you one row per booking with date, service, staff, client, status, source, price and paid. DMly’s docs don’t spell out the exact formula behind the No-show rate card, so check it once against the simple sum below. You need the Export reports permission.
- Repeat next month. One month is a snapshot. Three months is a trend you can act on.
If you’d rather work it out by hand from the CSV, the sum is simple.
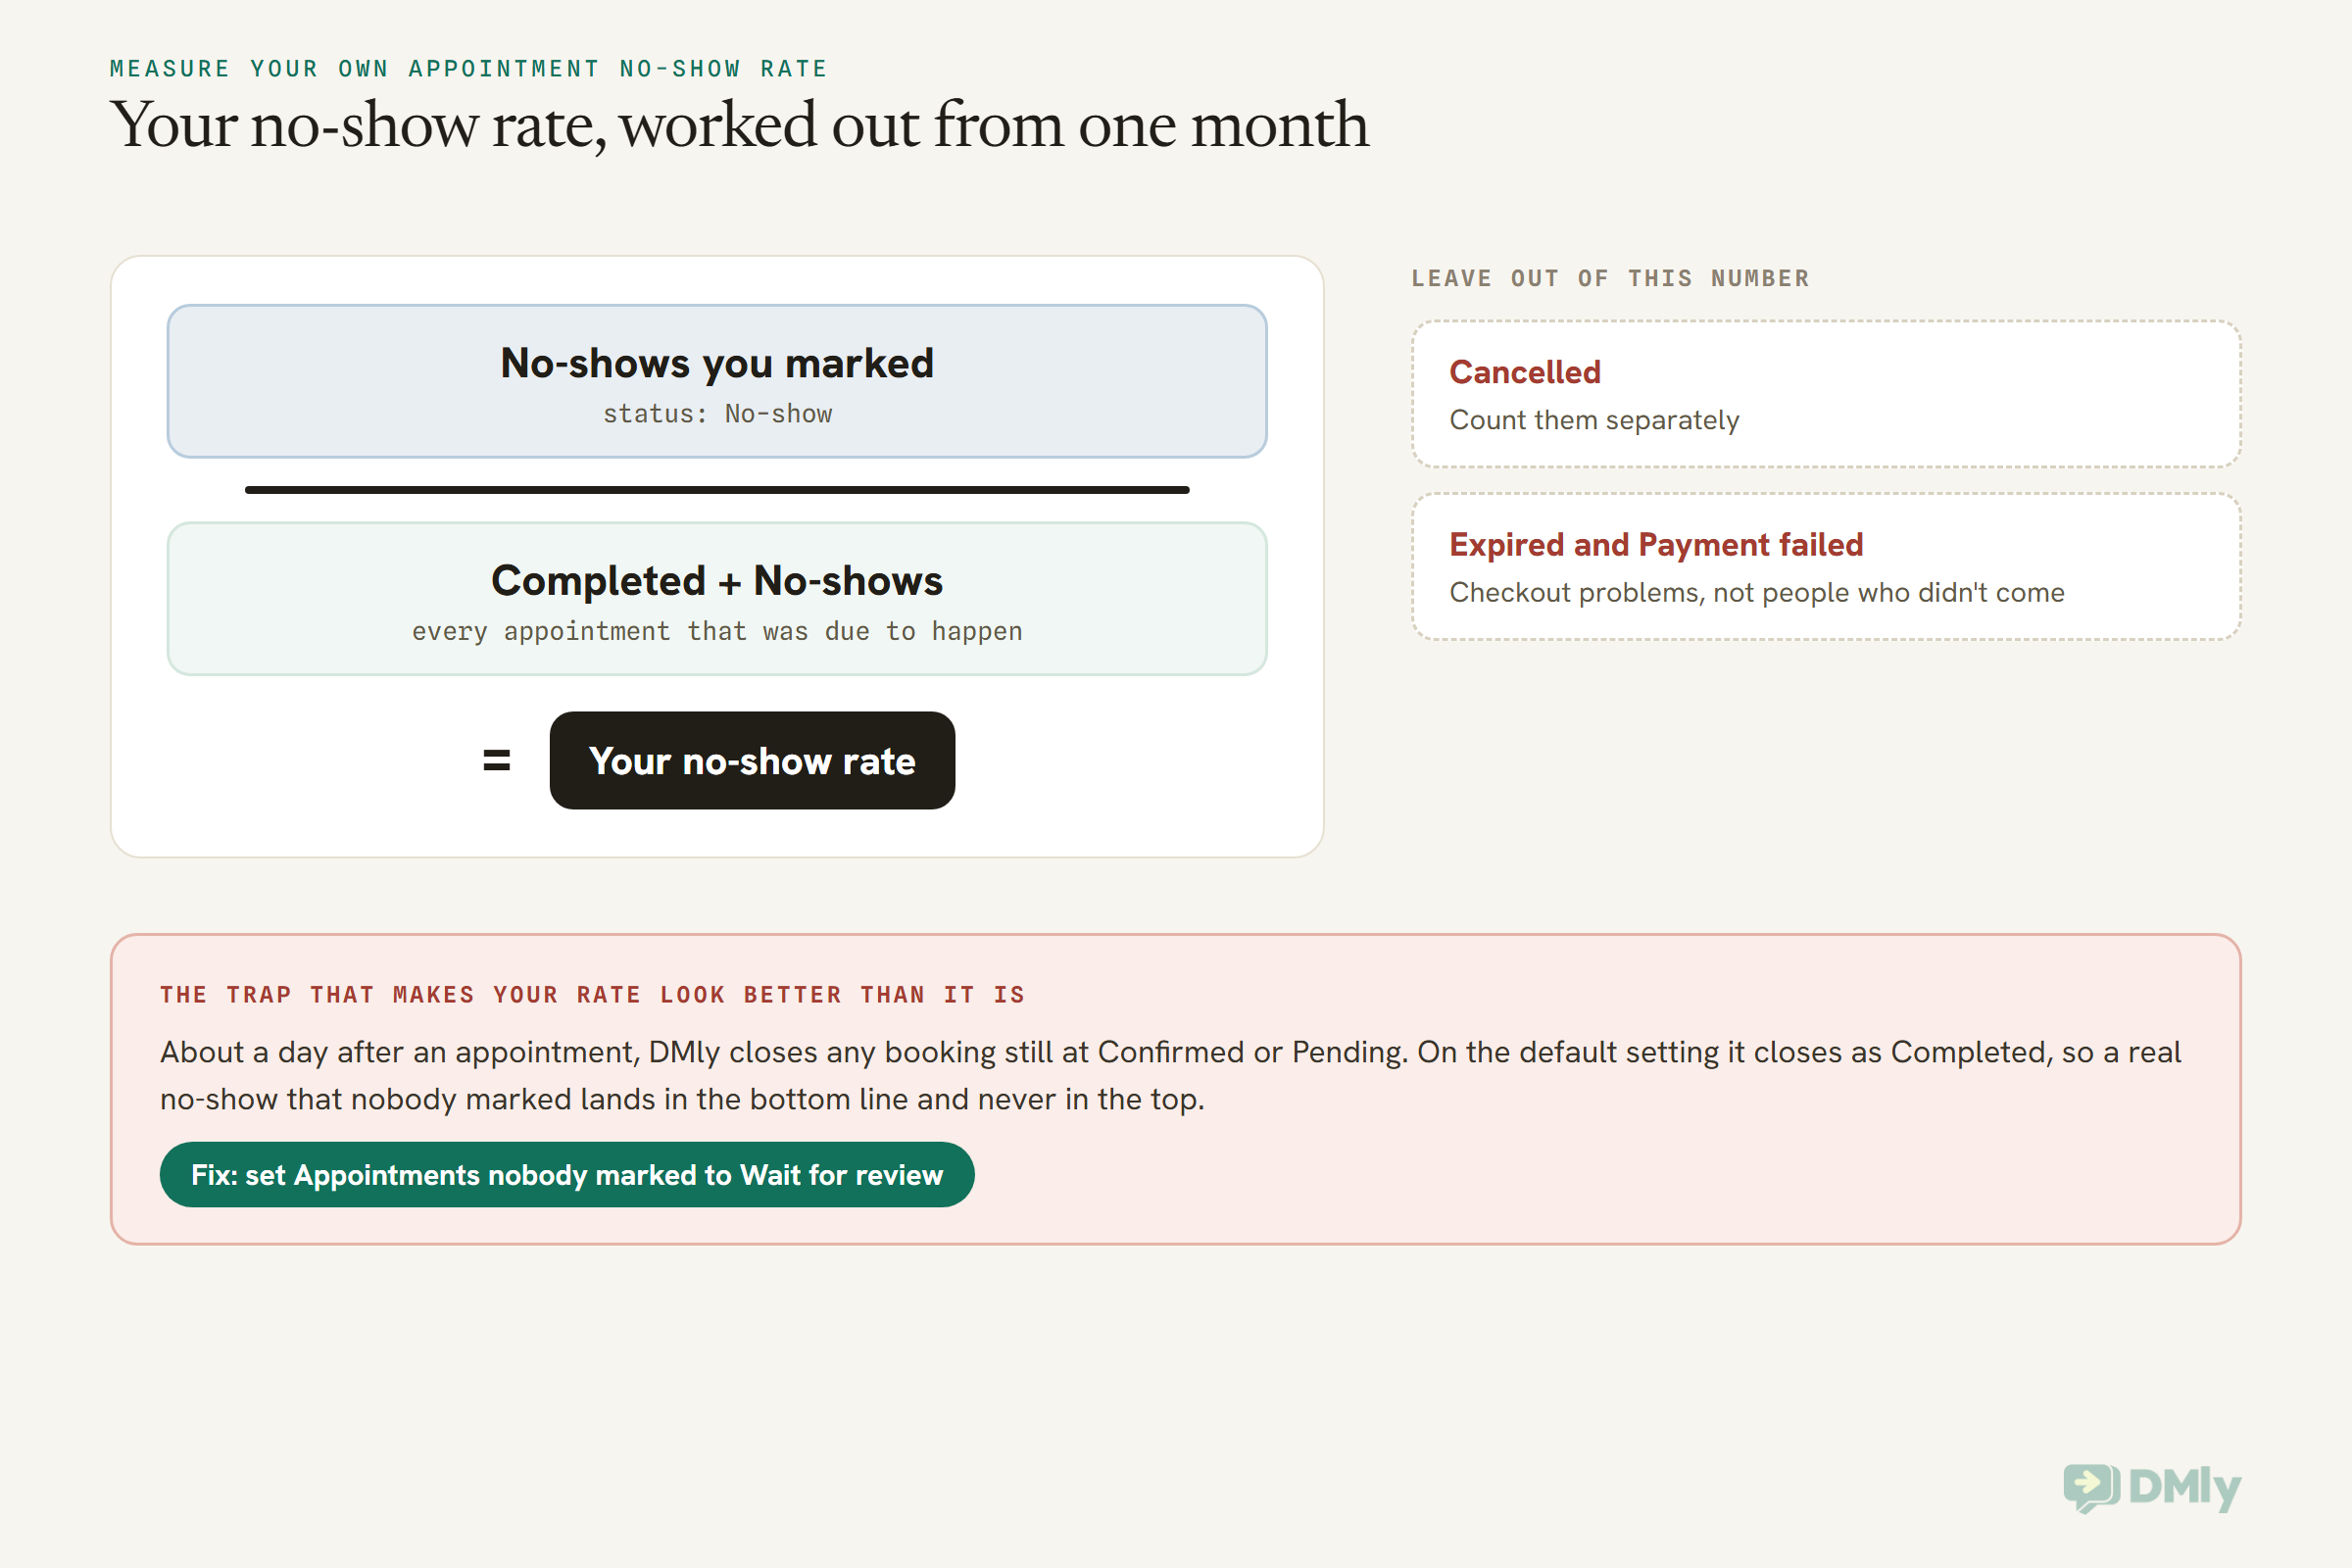
That trap deserves a proper explanation, because it quietly flatters almost every booking system’s numbers. DMly never decides on its own that someone didn’t show. About a day after an appointment, any booking still sitting at Confirmed or Pending is closed off automatically. Under Appointments, Settings, Booking policy, the setting called Appointments nobody marked decides how:
- Count as completed (the default) closes it as Completed. The Appointment completed trigger fires and loyalty points are awarded, even if the client never came.
- Wait for review sets it to Needs review and sends nothing. Your team gets one in-app notification a day until someone marks each booking completed or no-show.
On the Calendar, you have about a day to mark a one-to-one appointment as a no-show before those buttons disappear. Class rosters are the exception: you can mark Attended or No-show there afterwards. If you want a no-show rate you can trust, Wait for review is the safer choice, and DMly’s own docs recommend it if you charge no-show fees.
Once you have a real rate, put it into our no-show cost calculator with your average price. A rate feels small. A year of empty slots in money usually doesn’t.
Comparing your rate with the figures on this page
Compare like with like when you hold your number up against published appointment no-show statistics. If you run a clinic and your rate is around 4% to 6%, you’re in line with England’s national GP and hospital figures, which are the strongest numbers available. If it’s in the teens, you look more like the clinics researchers study, and the patterns above tell you where to look first: long booking gaps, a small group of repeat no-shows, and the appointment types or staff with the worst rows. If you run a salon, a studio or a tutoring business, there’s no published benchmark to compare with, so compare yourself with last month.
Fixing Your Rate in DMly: Reminders, Two-Way Confirmation, Deposits and No-Show Fees
Start with reminders, because they have the best evidence and cost the least. Then make cancelling easy, and add deposits or no-show fees only for the services where your own report says you need them. Each of these has its own full guide; here’s how they fit together.
Reminders on every booking
In DMly, reminders are set on each service under Offerings, Services, with reminder times such as a day before and an hour before. They go out on the client’s channel automatically once a booking is confirmed. A reminder is skipped, not retried, if the booking is no longer confirmed or the contact has opted out, and outside WhatsApp’s 24-hour window it only goes out on an approved template. Our guide to automatic appointment reminders on WhatsApp walks through the setup. The trials suggest two reminders beat one, and the English hospital trial suggests the wording matters too: say plainly what a missed slot costs.
Two-way reminders, so a no-show becomes a cancellation
A reminder that lets people confirm, reschedule or cancel in the chat doesn’t just remind them. It gives the person who was going to quietly not turn up an easy way to tell you, which frees the slot for someone else. Our guide to two-way WhatsApp appointment reminders shows how to build one. Clients can also cancel or reschedule from the link they were sent, within the deadlines you set under Appointments, Settings, Booking policy. Both deadlines start at 0, meaning clients can cancel right up to the start time. Leaving them there is a reasonable choice: a late cancellation is still better than a silent no-show.
Deposits for the services that need them
On any service set to Pay before booking, a Deposit field takes a percentage from 1 to 99. The client pays that share to book, and the rest is due at the appointment. DMly doesn’t collect the balance for you, and you need a connected payment gateway. Use your By service table to choose: the long, high-value services with the worst no-show rows are the obvious candidates. Our guide to accepting appointment deposits or full payment at booking covers the setup and the trade-offs.
No-show fees, used carefully
A No-show fee can be set on any service, whatever its payment mode, or as a workspace default under Appointments, Settings, Booking policy. It’s charged only when someone marks the booking as a no-show, once per booking. If the client pays a subscription automatically, their saved card is charged; for most clients, DMly sends a payment link instead, which they can simply leave unpaid. It also needs a connected gateway. Because it only fires on marking, pair it with Wait for review, or unmarked no-shows will never be charged.
For a step-by-step plan that ranks all of these levers, read how to reduce appointment no-shows with WhatsApp automation. And remember the mental health row above: in health care, a repeat no-show may be a person who needs a call, not a fee.
What this looks like in different businesses
These are illustrations of how to apply the patterns, not data:
- A family dental practice in Houston sees its worst rows on six-month check-ups booked at the last visit. That’s the long-lead-time pattern. An extra check-in two or three weeks before, asking whether the time still works, targets exactly that.
- A physiotherapy clinic in Lagos finds new patients booked weeks out go missing most. Offering the first slot sooner, even if it’s less convenient, follows the US military finding.
- A specialist clinic in Riyadh sees most no-shows come from a short list of repeat names. A personal call for that group, rather than a fee for everyone, follows the predictor every study agrees on.
- A salon in Mumbai has no industry benchmark to lean on, so it measures for a month, then puts a deposit on colour services only, because that’s where its report shows the empty chairs.
- A therapy practice in Manchester offers video for follow-ups, in line with England’s very low video no-show rate, while keeping first sessions in person.
Frequently Asked Questions
What do appointment no-show statistics say is a normal rate?
There isn’t one normal rate. England’s national data puts GP no-shows at about 4% and hospital outpatient no-shows at about 5.4%. Reviews of research studies find about 13% to 23% in healthcare, partly because researchers often study clinics with a problem. Your own rate, measured over a full month, is the only one worth planning around.
What is the average no-show rate for doctors’ appointments?
In England, about 4.2% of GP appointments were not attended in August 2026, out of 28.8 million. A 2021 systematic review of primary care studies found a mean of 15.2% and a median of 12.9%. One US safety-net system saw 25% of in-person appointments missed. The setting decides the number.
What is the average no-show rate for salons?
We couldn’t find a salon or barber no-show rate published with its sample and method, so we don’t quote one. Vendor figures exist, but they don’t say what they counted, and some bundle late cancellations in. Measure your own salon’s rate over a month instead.
Do reminders really reduce no-shows?
Yes, in healthcare trials. A Cochrane review found attendance rose from 67.8% to 78.6% with text reminders, and a 2016 meta-analysis found about 25% fewer no-shows with text notifications. Those trials used SMS, not WhatsApp; no published trial has tested WhatsApp reminders yet.
Do deposits reduce no-shows?
Probably, but we found no trial that proves it for salons, clinics or studios. In one large restaurant dataset, bookings with a payment requirement had a lower no-show rate (0.80% vs 2.47%), but the publisher itself says that comparison doesn’t prove an effect.
Is a late cancellation the same as a no-show?
No. A no-show gives you no warning at all. A late cancellation gives you a little, which sometimes lets you refill the slot. Track them separately, and treat failed or expired checkouts as a third, different problem.
How do I calculate my no-show rate?
Divide the bookings you marked as no-shows by completed plus no-shows, for a full month. In DMly, the Appointment reports page shows a No-show rate card and a breakdown by service and staff. Set unmarked bookings to Wait for review first, or real no-shows will be counted as completed.
The Label, Read: Using Appointment No-Show Statistics Well
Go back to the food packet. The label is useful not because the numbers are big or small, but because it tells you what each one is per. Appointment no-show statistics work the same way. England’s 4% and a research review’s 23% are both honest. They just answer different questions.
So read every figure you meet, including the ones on this page, with its label: who counted, out of what, where, how many, and when. Notice the patterns that hold everywhere: long gaps between booking and appointment, a small group of repeat no-shows, and travel. Then put your own label on your own number. Set unmarked bookings to Wait for review, open your Appointment reports for a full month, and write down your rate by service. That’s the one statistic on the subject that actually describes your business, and it’s the one that will tell you which fix to try first.
Writing about WhatsApp automation, bookings and growth for local business.
Turn WhatsApp into your busiest channel.
Start free and run message, bookings, payments and reviews in one place.
