
WhatsApp Business Statistics 2026: Usage, Open Rates and Adoption
The most famous WhatsApp business statistic in the world is a 98% open rate, and this page refuses to print it as fact, because in years of writing about this platform we have never once traced it to a primary source. It appears on hundreds of vendor blogs, always rounded the same way, never with a methodology attached, which is the statistical equivalent of a rumour wearing a suit.
That refusal is the editorial policy of everything below. This is a collection of WhatsApp Business statistics for 2026 built the way we wish every stats page were built: each number carries its source, its date and a trust label, official platform disclosures are kept separate from commissioned surveys and self-reported case studies, and where the honest answer is “Meta has not updated this figure since 2020”, the page says exactly that. Steal any of it for your deck; the labels come free.
How to Read These WhatsApp Business Statistics: The Trust Key
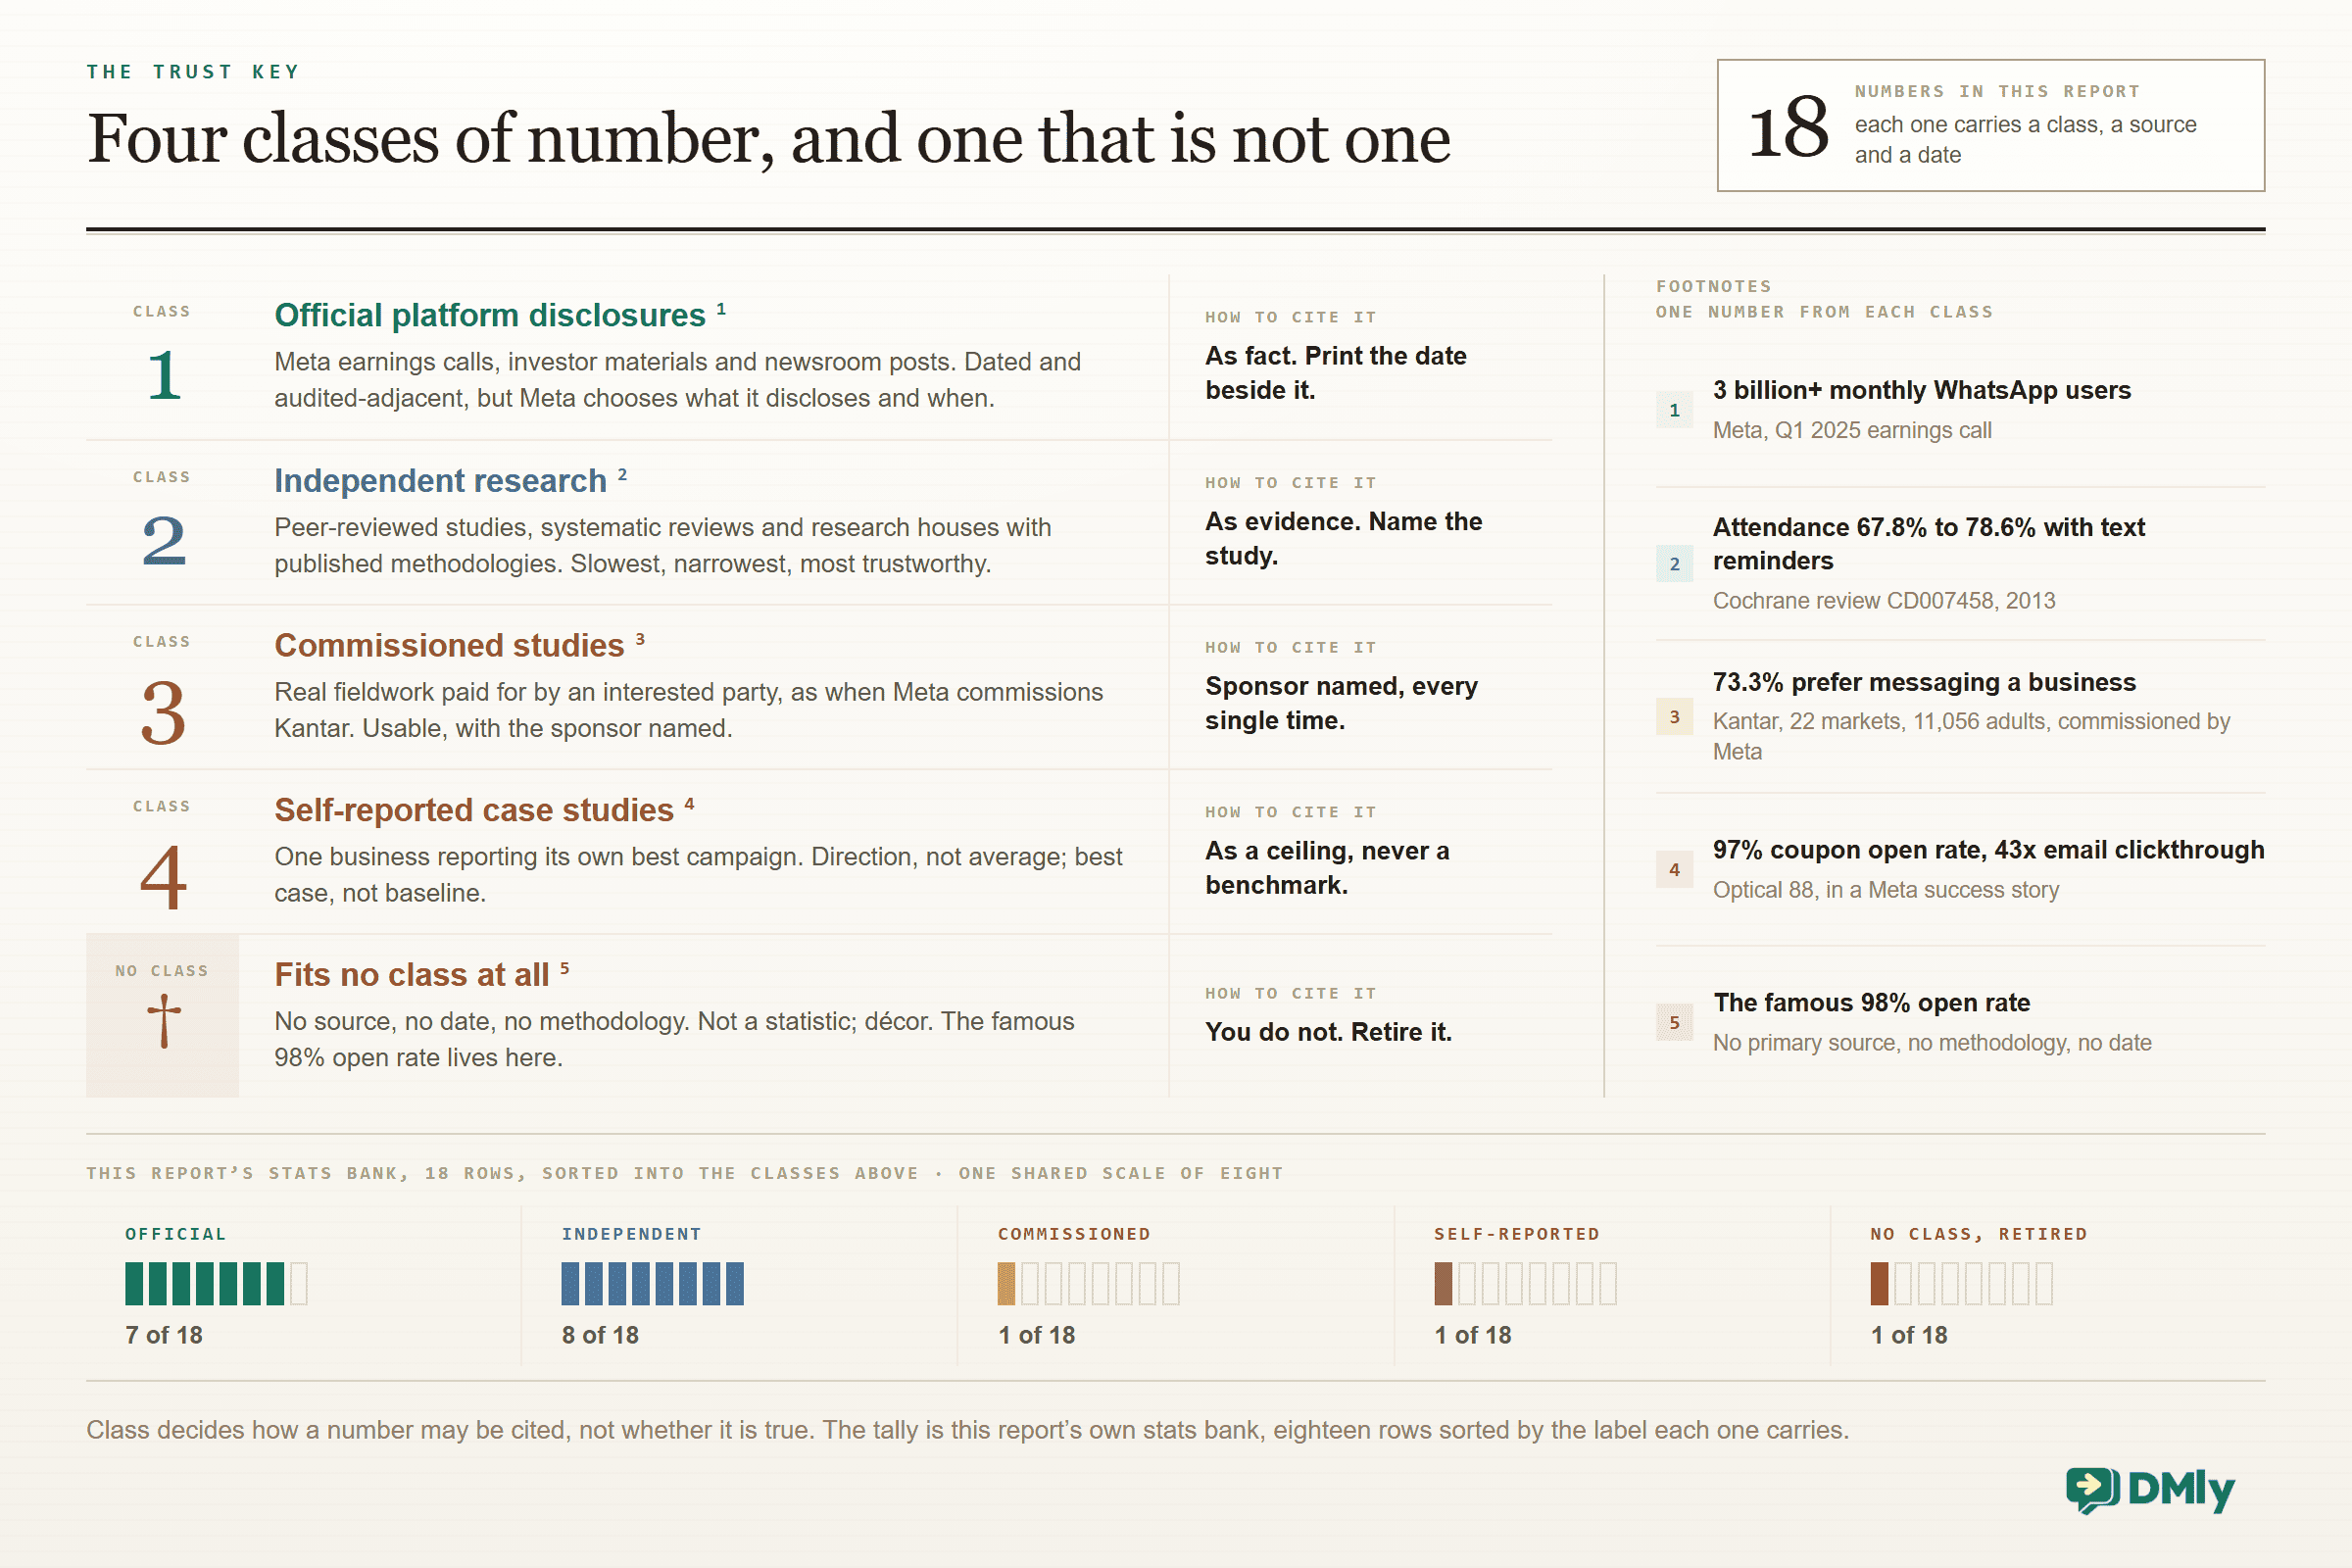
Four kinds of source produce almost every messaging statistic in circulation, and they deserve very different amounts of your confidence.
- Platform disclosures: Official Meta earnings calls, investor materials and newsroom posts. The numbers are audited-adjacent and dated, but the company chooses what to disclose and when.
- Independent research: Independent peer-reviewed studies, systematic reviews and research houses with published methodologies. Slowest, narrowest, most trustworthy.
- Commissioned studies: Commissioned real fieldwork paid for by an interested party (Meta commissioning Kantar, for instance). Usable, with the sponsor named every time.
- Vendor and case-study numbers: Self-reported a business reporting its own best campaign. Direction, not average; best case, not baseline.
WhatsApp Usage Statistics: The Official Numbers
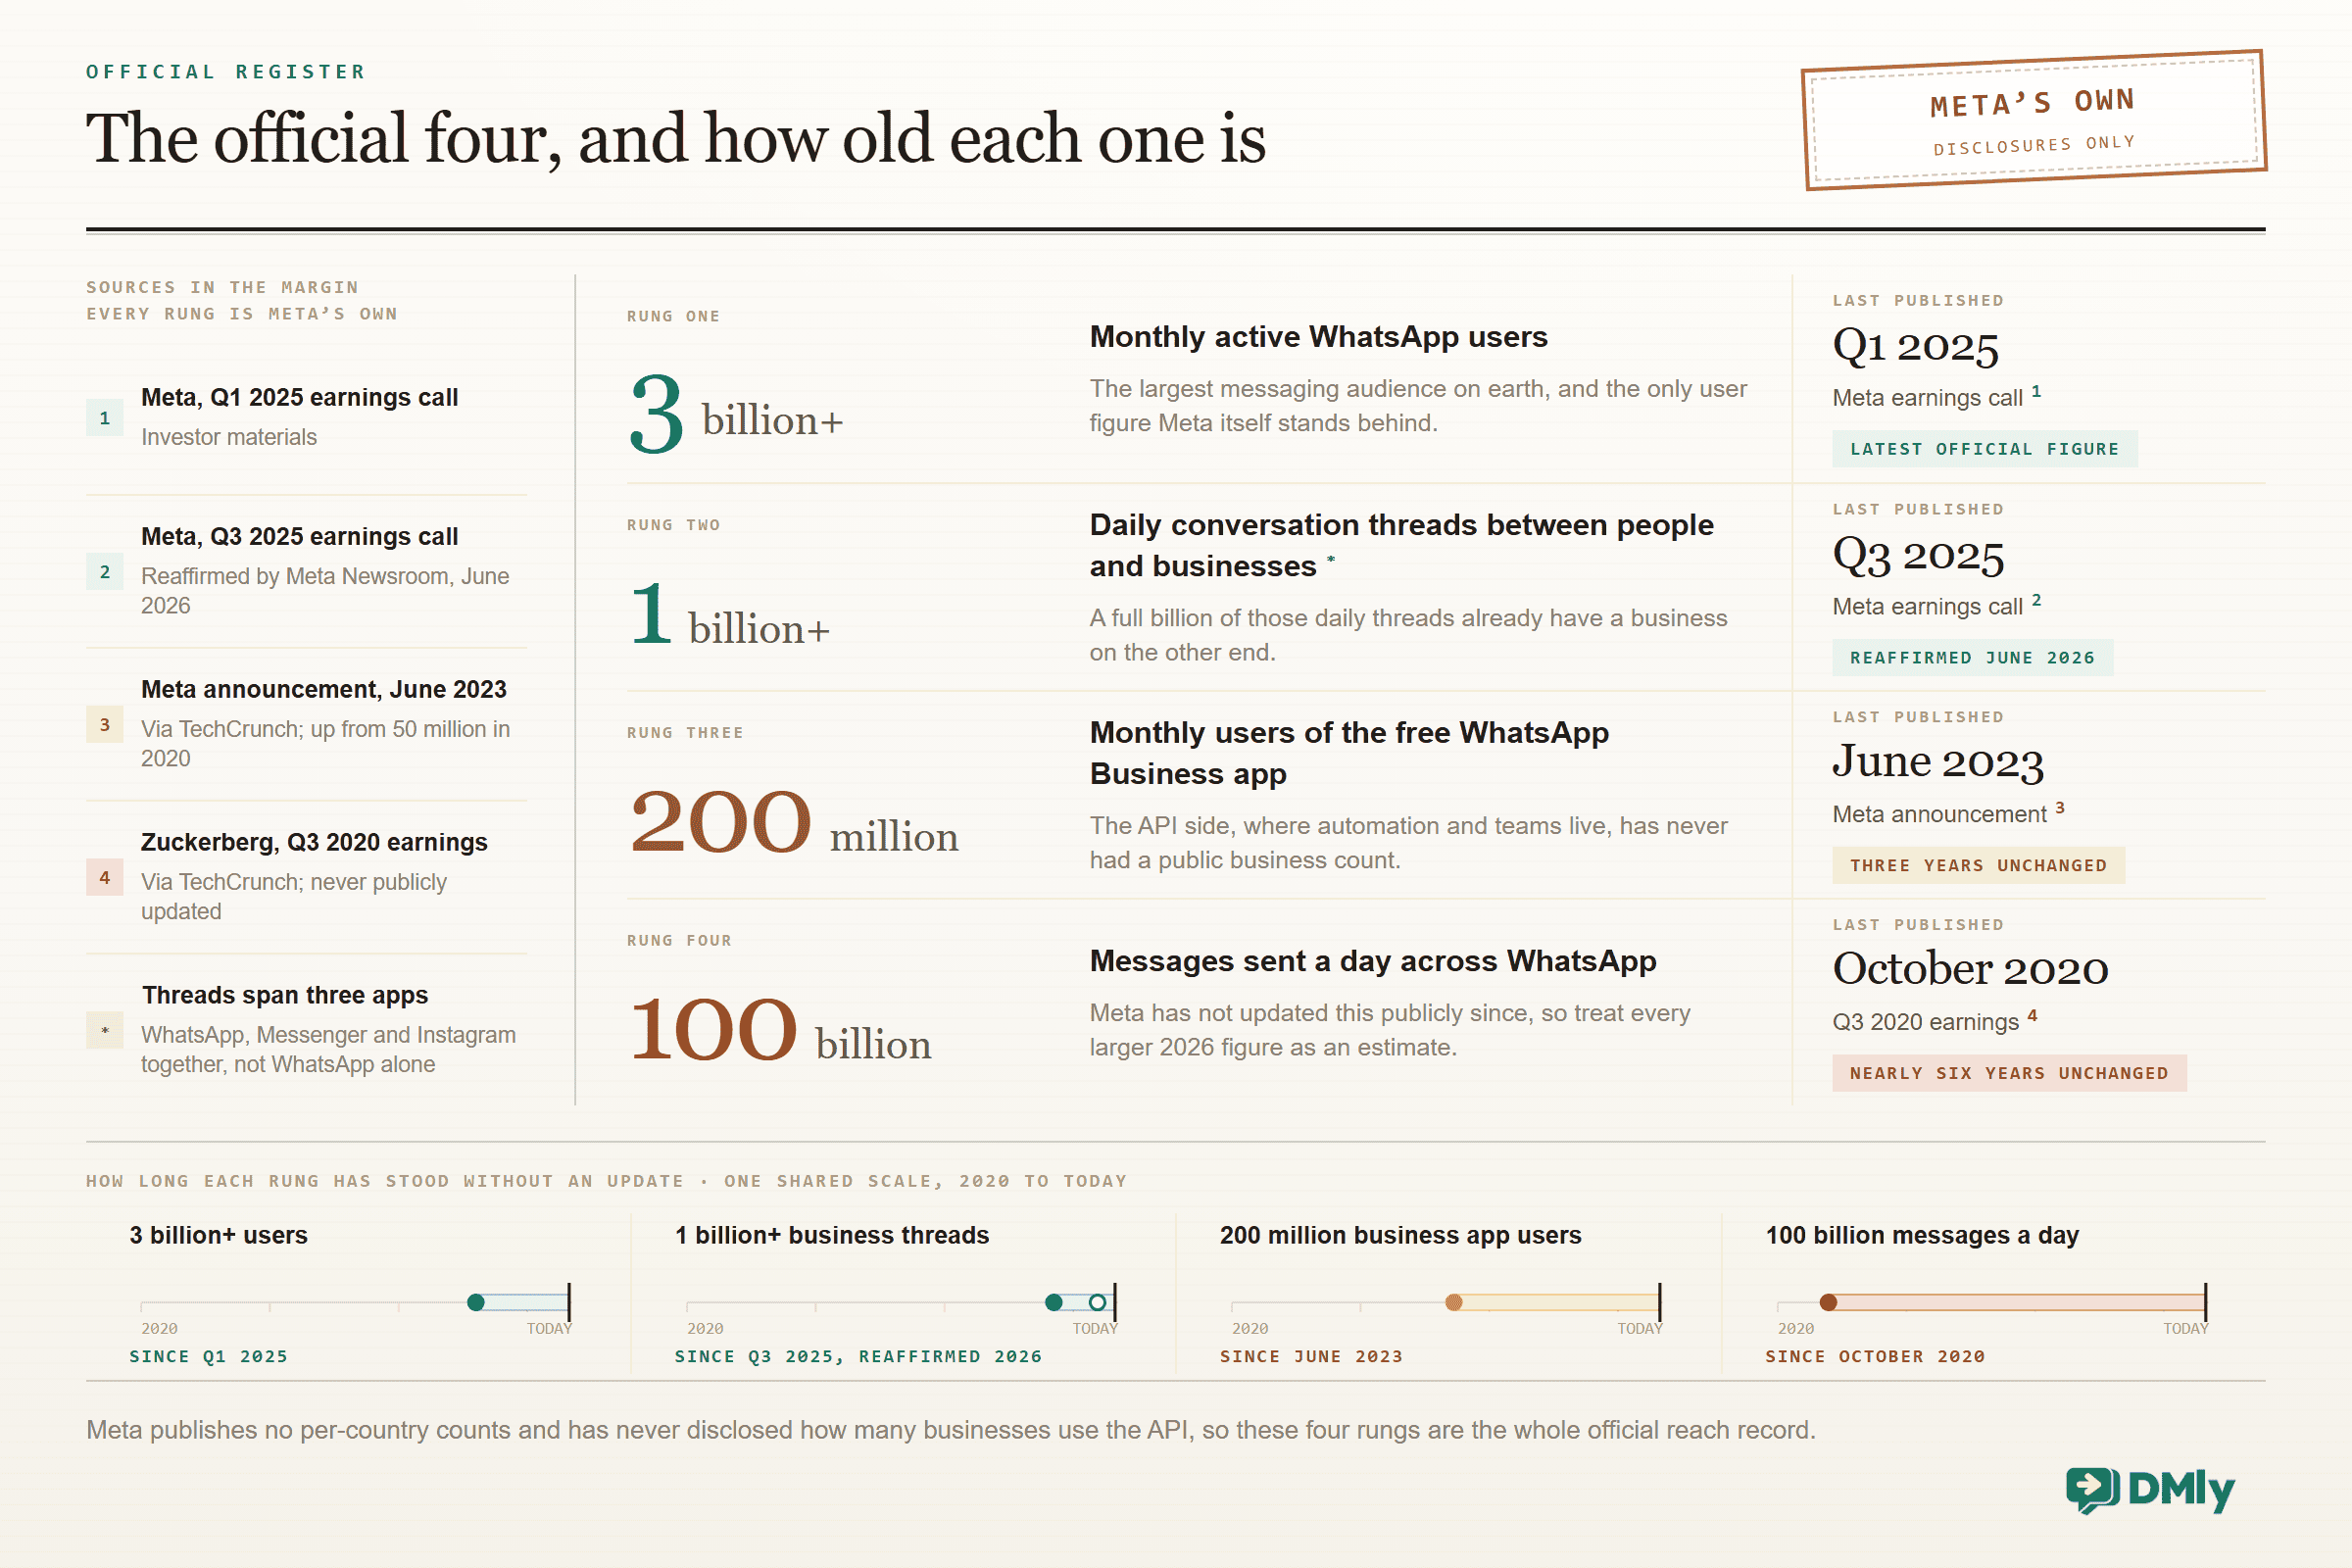
3 billion+ monthly active WhatsApp users, the largest messaging audience on earth Official Meta, Q1 2025 earnings call
100 billion messages a day, and here is the honesty the industry skips: Meta announced this in October 2020 and has not publicly updated the figure since, so treat every larger 2026 number you meet as an estimate Official Mark Zuckerberg, Q3 2020 earnings, via TechCrunch
1 billion+ conversation threads between people and businesses active every day across WhatsApp, Messenger and Instagram Official Meta, Q3 2025 earnings call; reaffirmed Meta Newsroom, June 2026
Read together, the three numbers describe the ground truth under every strategy this blog writes about: the audience is effectively everyone with a smartphone outside the US-and-China duopoly of iMessage and WeChat, the messaging habit is deep enough that Meta stopped counting publicly, and a full billion of those daily threads already involve a business on the other end. For a local business the practical translation is blunt: your customers are not deciding whether to use WhatsApp this year; they are deciding whether you are on it.
Business Adoption Statistics
200 million monthly users of the free WhatsApp Business app when Meta last disclosed the figure, in June 2023, up from 50 million in 2020; the API side, which this blog covers, has never had a public business count Official Meta announcement, June 2023, via TechCrunch
+60% year-over-year revenue growth in click-to-WhatsApp ads, the ad format whose button opens a chat instead of a website Official Meta, Q3 2025 earnings call
~$135 billion projected global conversational commerce spend by 2027, with 47% flowing through OTT messaging apps like WhatsApp Independent Juniper Research, 2023 forecast
The adoption story hides in the gap between those first two numbers. Two hundred million businesses already message customers from the small-business app, but the growth Meta actually reports on earnings calls is in the paid doorway into API conversations, which is where automation, teams and commerce live. When the ad product growing 60% a year exists to start chats, the platform’s direction of travel is not subtle: business messaging is the product now, and the countries where WhatsApp is the default phone line (India, Brazil, Indonesia and most of Africa and Latin America) are where the playbooks in this series were forged.
What Customers Say They Want
73.3% of consumers say they prefer messaging when dealing with a business, and 72.4% say they are more likely to purchase from a brand that offers it Commissioned Kantar, “The State of Business Messaging” (11,056 adults, 22 markets), commissioned by Meta; sponsor named for a reason
90% of customers rate an immediate response as important or very important when they have a service question, and 60% define “immediate” as ten minutes or less Independent HubSpot Research
63% of consumers say they would switch to a competitor after just one bad experience, up 9% year on year; the same report found 64% are more likely to trust AI agents that show friendliness and empathy Independent Zendesk, CX Trends Report 2025
Note what these three actually measure: preference, expectation and threat, in that order. The Kantar figures carry their sponsor’s interests (Meta funds research into whether messaging is good), which is why they wear the commissioned badge, but the HubSpot and Zendesk findings need no messaging agenda to matter: customers expect answers in minutes and punish businesses that miss, on whatever channel. Messaging platforms simply happen to be where answering in minutes is operationally cheap, which is the entire strategic argument for the automation this blog teaches.
WhatsApp Open Rates: What Is Actually True
Here is the section the 98% crowd never writes. There is no independent, methodologically published study of average WhatsApp open rates. None. The famous figure circulates from vendor blog to vendor blog without a primary source, and it survives because it is useful, not because it is verified. What can be said honestly comes in three parts:
- The mechanism favours high visibility. WhatsApp messages land in the same inbox as family group chats, with notifications on by default for most users, so far more messages get seen than in an email inbox with a promotions tab. Directionally, messaging beats email on attention; precisely, nobody has a universal number.
- The best published case is 97%, and it is a case, not an average. Hong Kong retailer Optical 88 reported a 97% open rate on WhatsApp coupons and a clickthrough 43 times its email rate, in a Meta success story. Self-reported, best case, one business: cite it with all three labels attached, as we just did.
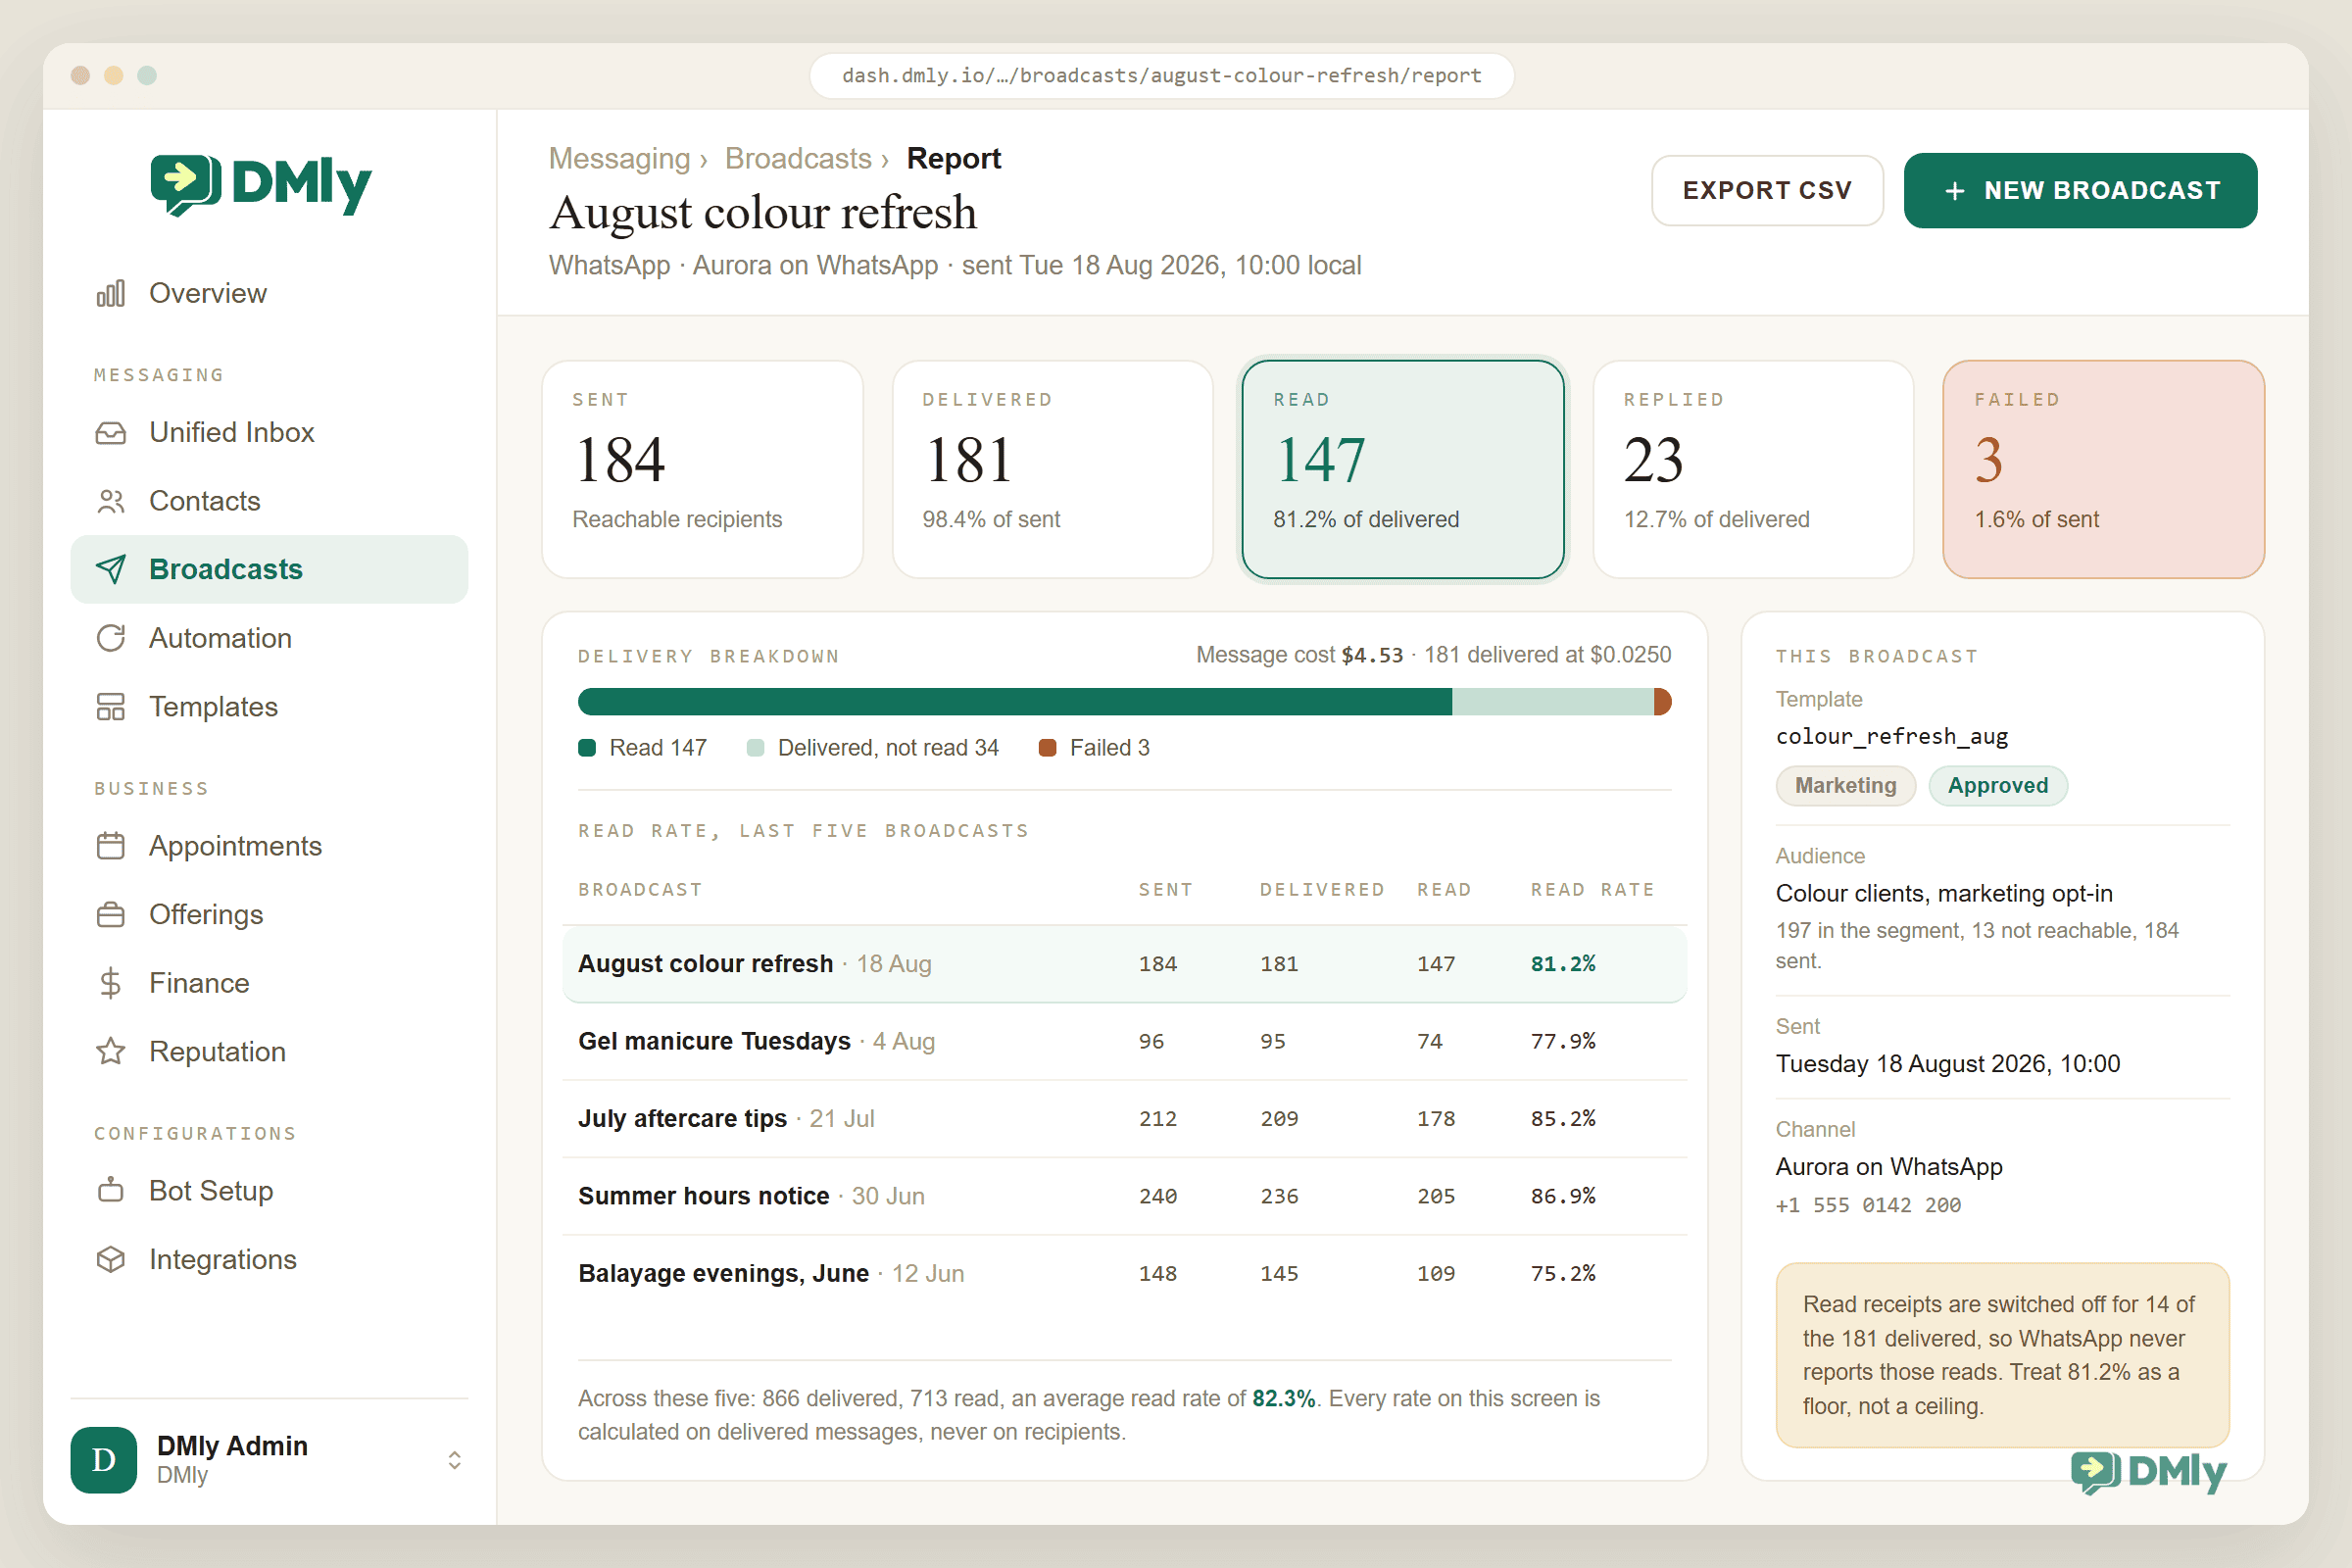
- Your own report is the only open rate that matters. Delivery is billed and reported per message; read receipts can be disabled by users, so measured “read” rates undercount reality. A healthy opted-in local list typically sees read rates that would make an email marketer weep, but the number that should run your business is the one in your own broadcast report, not anyone’s blog.
Retire this statistic: “WhatsApp has a 98% open rate” has no traceable primary source and should not appear in your deck, your ads or your investor material. Say instead: “Meta reports over a billion daily business conversations, and our own list reads at X%,” where X comes from your report. Stronger claim, fully defensible, and it makes you the only vendor in the room whose numbers survive a due-diligence question.
Outcome Statistics: What Messaging Measurably Changes
The strongest evidence in this entire field is not about marketing at all; it is about reminders and attendance, and it is peer-reviewed:
67.8% → 78.6% attendance without versus with text-message appointment reminders (risk ratio 1.14), pooled across seven trials and 5,841 people, at 55% to 65% lower cost per attendance than phone reminders Independent Cochrane review CD007458 (Gurol-Urganci et al., 2013)
25% fewer no-shows among patients receiving text notifications (15% versus 21%), in a meta-analysis of 21 studies Independent Robotham et al., BMJ Open, 2016
~23% average no-show rate across 105 studies of scheduled appointments, with long lead times and prior no-shows the strongest predictors, which is the baseline problem reminders exist to attack Independent Dantas et al., Health Policy, 2018
70.22% average documented online shopping cart abandonment rate across 50 studies, the leak that chat-based checkout and recovery nudges target Independent Baymard Institute, updated September 2025
Two honest footnotes. The reminder evidence is from SMS studies in healthcare, because that is where randomised trials get funded; WhatsApp inherits the mechanism (a phone notification before a commitment) rather than the exact numbers. And the abandonment figure is for web checkouts generally, not WhatsApp carts specifically; it earns its place here as the measured size of the problem conversational commerce goes after, not as a claim about WhatsApp’s cure rate.
The Money Statistics Behind the Messaging
59% of US small businesses had invoices overdue by more than 30 days, up from 47% a year earlier, with the average waiting business owed $17,700; on payment terms, 55% of net-30 businesses had overdue invoices against 26% of those asking for immediate payment Independent Intuit QuickBooks, 2026 Late Payments Report (July 2026)
£11 billion a year is what late payments cost the UK economy, shutting down 38 businesses every day Official GOV.UK, Department for Business and Trade, July 2025
These two belong on a page of WhatsApp business statistics because they price the problem the payment features solve: invoices chased where they actually get read, payment links inside the conversation, reminders that fire on due dates without anyone feeling awkward. Our guide to invoicing through WhatsApp turns both numbers into a build.
What WhatsApp Messaging Costs in 2026
Since July 2025, Meta prices business messaging per delivered template message, by category and country, and the official 2026 rate card puts real numbers under every strategy on this blog: marketing messages from $0.0118 in India to $0.0250 in North America, $0.0516 in Nigeria, $0.0625 in Brazil and up to $0.1365 in Germany, with utility messages at a fraction of those rates ($0.0014 in India, $0.0034 in North America). Two things that were free up to 30 September 2026 stop being free the next day: from 1 October 2026 Meta charges for replies sent inside the 24-hour window and for utility templates delivered while that window is open, both at the recipient market’s utility rate. Conversations born from click-to-WhatsApp ads keep their 72-hour free window. The full 19-market table, worked examples and volume-tier rules live in our WhatsApp Business API pricing rate card, and the total cost of ownership, platform plus messages, is worked through in our chatbot cost breakdown.
Where WhatsApp Business Concentrates: Reading the Map Meta Publishes
Meta publishes no per-country user counts, but it publishes something almost as revealing: the structure of its own price list. The official 2026 rate card gives dedicated country rows to exactly the markets where business messaging volume justifies individual pricing (India, Brazil, Indonesia, Mexico, Nigeria, Pakistan, Egypt, Saudi Arabia, the UAE, South Africa, the UK, Germany, France and North America among them) and sweeps everywhere else into regional buckets like “Rest of Africa” and “Rest of Latin America”. A country earns its own row when enough businesses message enough customers there for the pricing to matter; the rate card is a heat map wearing a spreadsheet’s clothes.
The same reading explains the strategy in this series. The markets with dedicated rows and low marketing rates (India at $0.0118 is the flagship) are where campaign-led WhatsApp selling matured first, because the arithmetic allowed experimentation; the markets with dedicated rows and high rates (Germany at $0.1365) are where WhatsApp business practice skews operational (confirmations, reminders, support) because every marketing send has to earn its keep. Where your country sits on that card predicts, better than any adoption survey, which playbooks in this blog will feel native and which will need adapting. That is also why our rate card page reads less like a price list and more like a strategy document.
The WhatsApp Business Statistics That Do Not Exist (and What People Use Instead)
An honest statistics page should list its own holes, because the holes are where the fabrications grow. Here are five numbers everyone wants and nobody legitimately has.
- Businesses on the WhatsApp Business API. Never disclosed. The 200 million figure covers the free small-business app only; API adoption is inferred from earnings commentary and the growth of click-to-WhatsApp ad revenue.
- Per-country user counts. Meta publishes none. Every “WhatsApp has X million users in India” claim traces to third-party estimators with undisclosed methods; cite them as estimates or not at all.
- An average open rate. No independent study exists, which is how 98% conquered the world unopposed. Your broadcast report is the only trustworthy instance of this statistic.
- Current daily message volume. Frozen officially at 100 billion since October 2020. Larger figures are extrapolations.
- WhatsApp-specific conversion benchmarks. Cart recovery rates, booking conversion rates and campaign ROI circulate as vendor anecdotes; no methodologically published cross-business benchmark exists. Collect your own within a quarter and you will hold better data than the industry does.
When a number you meet claims to fill one of these five holes, you now know the question to ask it: who measured this, when, and on what sample? In our experience the answer is usually a chain of blog posts citing each other in a circle, which is not a methodology, however many links the circle has.
Five Ways to Put These WhatsApp Business Statistics to Work
- In a pitch or business case, lead with the official ladder (3 billion users, 1 billion daily business threads, +60% ad growth) and date each figure; the dates read as rigour, and rigour is the pitch.
- Convincing a sceptical partner or boss, skip reach entirely and use the outcome evidence: Cochrane’s 67.8% to 78.6% attendance lift is the single most persuasive number in this field for anyone who runs a diary.
- In ad copy and landing pages, never use the 98% claim (unsourced claims in performance marketing age badly, occasionally legally); quote your own read rate once you have one, which takes exactly one broadcast.
- Setting internal benchmarks, measure a baseline month before automating (response time, no-show rate, share of invoices paid late), then let your own before-and-after become the statistic. That is why every guide on this blog ends up pointing at a report screen.
- For the annual refresh, re-check the earnings-call figures each quarter-one, swap dates forward, and prune anything that has gone two years without an update into the “stale but official” drawer where our 100 billion now lives.
The Stats Bank: Every Number on One Table
For decks, briefs and settling arguments: every statistic on this page, with its label, source and vintage. Rows are ordered by trust layer.
| Statistic | Number | Label | Source and date |
| WhatsApp monthly active users | 3 billion+ | Official | Meta, Q1 2025 earnings |
| Daily messages on WhatsApp | 100 billion | Official (stale) | Meta, Oct 2020, never updated |
| Daily business conversation threads (Meta apps) | 1 billion+ | Official | Meta, Q3 2025 earnings; Newsroom Jun 2026 |
| WhatsApp Business app monthly users | 200 million | Official (2023) | Meta, Jun 2023 |
| Click-to-WhatsApp ads revenue growth | +60% YoY | Official | Meta, Q3 2025 earnings |
| UK late-payment cost / closures | £11bn a year / 38 a day | Official | GOV.UK DBT, Jul 2025 |
| Marketing message rates (sample) | $0.0118 to $0.1365 | Official | Meta rate card, effective Jul 2026 |
| Reminder effect on attendance | 67.8% → 78.6% (RR 1.14) | Independent | Cochrane CD007458, 2013 |
| No-shows with text notifications | 15% vs 21% (25% fewer) | Independent | Robotham et al., BMJ Open, 2016 |
| Average appointment no-show rate | ~23% | Independent | Dantas et al., Health Policy, 2018 (105 studies) |
| Cart abandonment average | 70.22% | Independent | Baymard Institute, updated Sep 2025 |
| Conversational commerce by 2027 | ~$135bn, 47% via messaging | Independent | Juniper Research, 2023 |
| Immediate response expectation | 90% (60% say ≤10 min) | Independent | HubSpot Research |
| Switch after one bad experience | 63% (+9% YoY) | Independent | Zendesk CX Trends, 2025 |
| US SMBs with 30-day overdue invoices | 59%, avg $17,700 owed | Independent | QuickBooks Late Payments Report, Jul 2026 |
| Prefer messaging a business / more likely to buy | 73.3% / 72.4% | Commissioned (Meta) | Kantar, 22 markets, 11,056 adults |
| Best published open-rate case | 97% (coupons), 43x email CTR | Self-reported | Optical 88, Meta success story |
| “98% open rate” | Retired | Unsourced | No primary source; do not cite |
How to Cite WhatsApp Business Statistics Without Embarrassing Yourself
Three habits, learned from auditing hundreds of messaging stats for this blog. Date every number: “3 billion users (Meta, Q1 2025)” is information; “3 billion users” is decoration that rots silently. Name the sponsor of commissioned work: the Kantar findings are real fieldwork and still deserve their “commissioned by Meta” tag every single time, because a reader who discovers the sponsorship later distrusts you, not Kantar. Keep case studies in the best-case drawer: Optical 88’s 97% tells you what the ceiling looks like for a beloved brand’s coupons, not what your Tuesday broadcast will do, and any agency quoting it as a benchmark has told you something about the agency. Every page on this blog follows those three rules, which is why its claims survive scrutiny, and yours can too.
The Changelog: What Changed in the Platform’s Numbers This Year
Statistics pages rot fastest at the rules layer, so here is the recent official history every 2026 number sits on. July 2025: Meta switched WhatsApp business pricing from per-conversation to per delivered template message, the single biggest economic change in the platform’s business history, and made utility templates free when delivered inside an open service window. October 2025: the On-Premises API formally expired, ending the era of self-hosted WhatsApp servers and completing the move to Cloud API infrastructure; any tutorial or cost analysis you find that discusses hosting your own WhatsApp server now describes a product that no longer exists, which is a useful freshness test for everything else that page claims. Through 2025 and 2026: volume tiers arrived for high-volume senders, discounting marketing rates as monthly portfolio-wide charged volume climbs, and the messaging limits ladder (from 250 unique customers a day for new numbers, stepping through 2,000, 10,000 and 100,000 to unlimited) continued to govern how fast a new business can scale broadcasts. June 2026: Meta’s newsroom reaffirmed the billion-plus daily business threads figure. July 2026: the current USD rate card took effect, the one all cost figures on this page use. October 2026: on the first of the month Meta began charging for two categories that had been free since the July 2025 change, namely service messages sent inside the 24-hour window and utility templates delivered while that window is open, both at the recipient market’s utility rate; our guide to the 1 October pricing change works through what it means for a normal month.
The pattern across those changes is worth one sentence of analysis. Every move rewards businesses that get real replies and taxes volume for its own sake: the service window went from free to merely the cheapest rate on the card rather than to the dearest, utility stayed a fraction of marketing, and messaging limits still rise with quality rather than with spend. The platform’s pricing evolution and this blog’s editorial advice have been converging on the same sentence for two years: message fewer people, better.
WhatsApp Business Statistics FAQs
How many users does WhatsApp have in 2026?
More than 3 billion monthly active users, per Meta’s Q1 2025 earnings call, the most recent official figure. Third-party estimates for 2026 run higher, but Meta has not published an update, so 3 billion+ is the number that survives fact-checking.
How many businesses use WhatsApp?
The last official count was 200 million monthly users of the free WhatsApp Business app, announced by Meta in June 2023; no public figure exists for businesses on the API. The livelier official signal is activity: over 1 billion business conversation threads daily across Meta’s apps, and click-to-WhatsApp ad revenue growing 60% year on year.
What is the real open rate of WhatsApp messages?
No independent published average exists, and the famous 98% figure has no traceable primary source. The best published case is a self-reported 97% for one retailer’s coupons in a Meta success story. Directionally, WhatsApp messages get seen far more than email; precisely, the only open rate that matters is the read rate in your own broadcast reports.
How many messages are sent on WhatsApp per day?
Around 100 billion, per Mark Zuckerberg in October 2020, and Meta has not updated the figure publicly since. Any larger 2026 number you encounter is an estimate; cite the official one with its date and you cannot be faulted.
Which country uses WhatsApp the most?
Meta publishes no per-country counts, so every specific national figure you see is a third-party estimate. India is universally reported as the largest market, and the official evidence agrees indirectly: it holds a dedicated row on Meta’s rate card with the lowest marketing rate of any major market, and new business features have repeatedly launched there first. Brazil and Indonesia follow in most estimates.
Do WhatsApp reminders actually reduce no-shows?
The peer-reviewed evidence on message reminders is strong: a Cochrane review found attendance rose from 67.8% to 78.6% with text reminders, and a BMJ Open meta-analysis found 25% fewer no-shows (15% versus 21%). The trials were SMS in healthcare, so WhatsApp inherits the mechanism rather than the exact numbers, but the mechanism is the point: a notification before a commitment changes behaviour.
Generate your own WhatsApp business statistics
The numbers that will actually run your business are your read rates, booking rates and no-show rates, and they live in your own reports. Put the machinery behind them on your number this week.
The Numbers, Honestly Held
Strip the folklore and the true picture is stronger than the myth: three billion people on the app, a billion business conversations a day, the fastest-growing ad format on earth pointing into chats, peer-reviewed evidence that message reminders move attendance, and per-message costs still measured in cents. Nobody needs a fake 98% when the sourced WhatsApp business statistics read like that.
Take the labelled versions, date them in your deck, and refresh here each year; this page will keep its labels honest so you can keep yours. And when a statistic you need is missing from this page, treat that as information too: it usually means the honest version does not exist yet, and the version circulating is décor.
Writing about WhatsApp automation, bookings and growth for local business.
Turn WhatsApp into your busiest channel.
Start free and run message, bookings, payments and reviews in one place.
